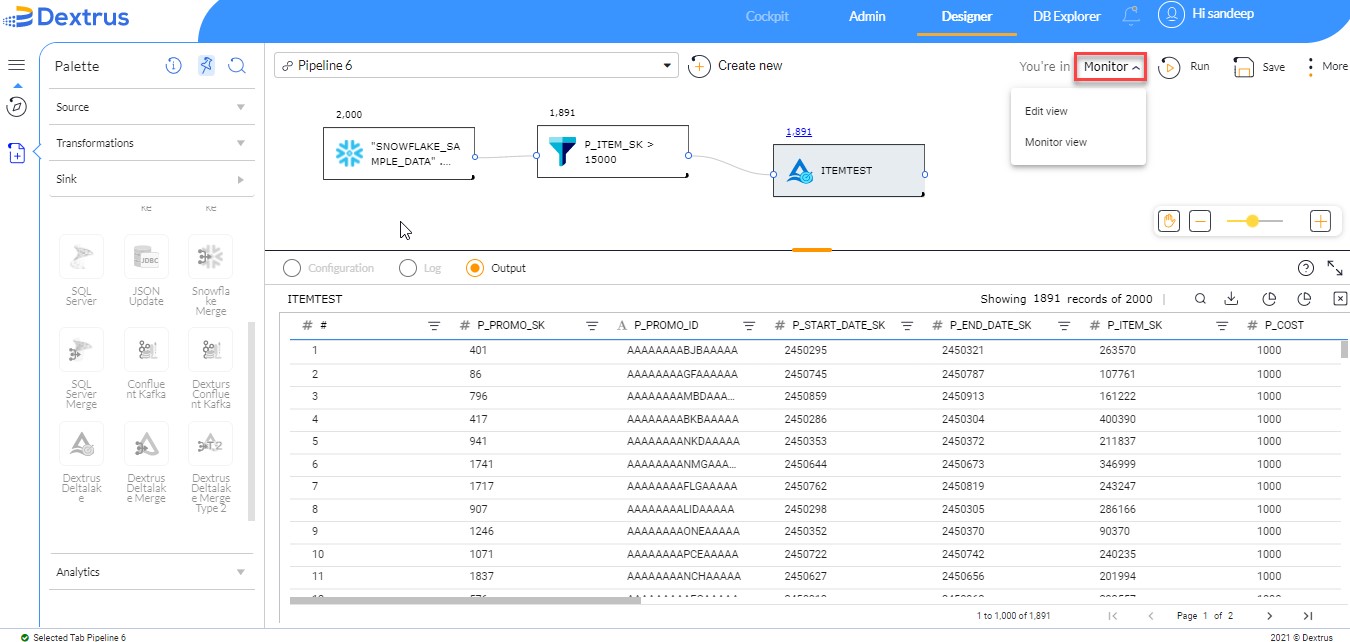
This user guide walks you through the process of creating an ad hoc batch pipeline to analyze the source data and it's journey from source database to target database thru a simple filter transformation widget.
Source: Snowflake
Target: Dextrus Deltalake (Dextrus Lakehouse)
Transformation widgets used: Filter
Sample Use case: to extract data from Snowflake (Using an RDBMS connection) filter the data based on certain conditions and then transfer the data to sink, which is Dextrus Deltalake orDextrus lakehouse in this example.
Note: The source database can be any database that can be accessed through JDBC connections.
- Once the user login credentials are successfully authenticated, the user is landed on the Dextrus homepage.
- the ‘Designer’ tab is selected on the homepage.
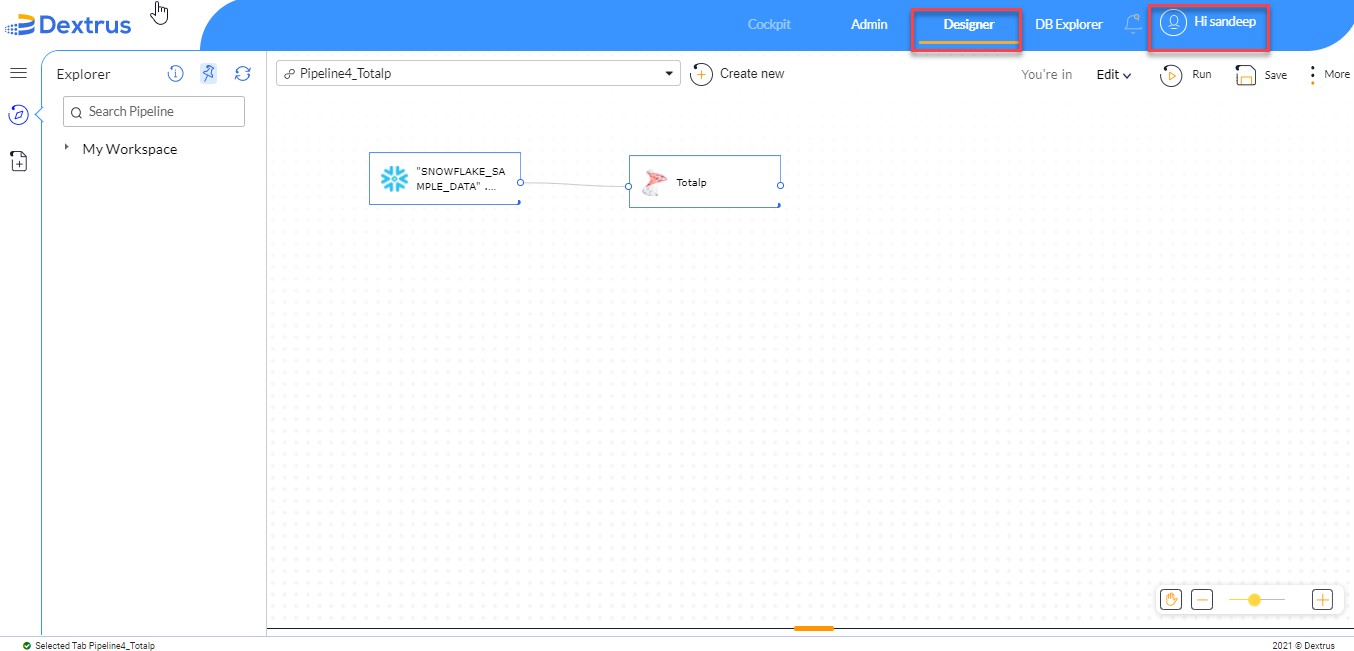
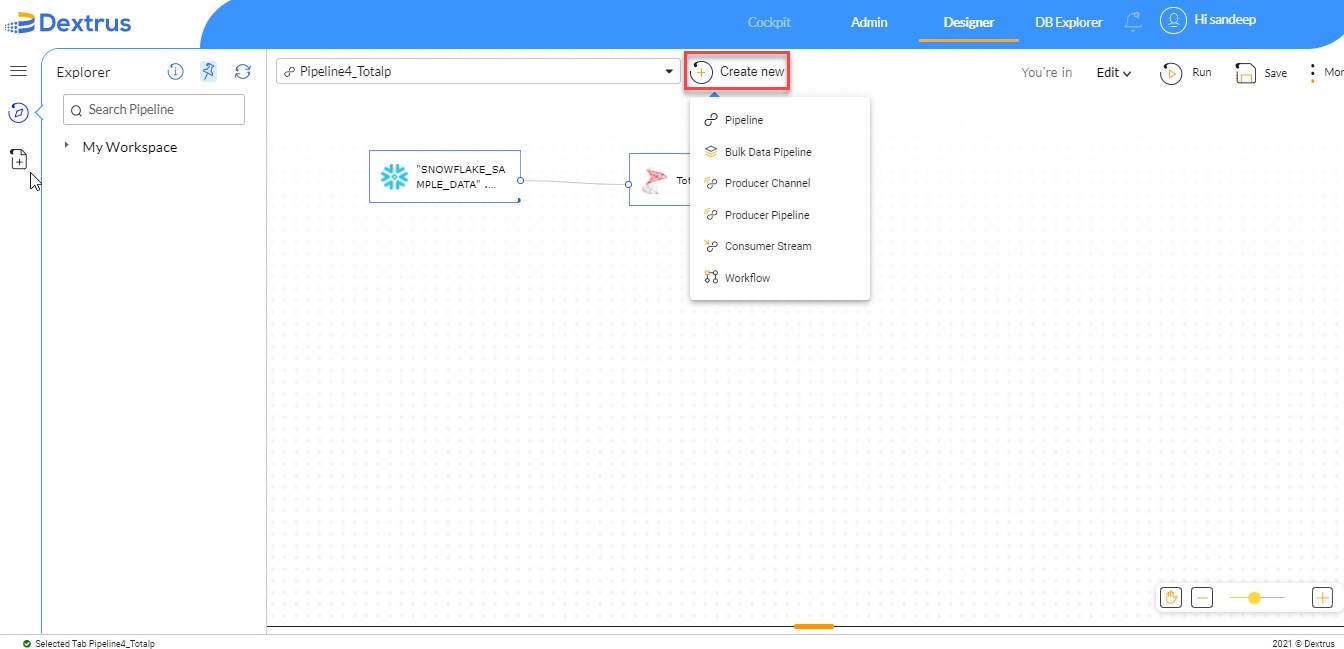
- Navigate to the Create New button to create a new pipeline.
- A drop-down list is displayed showing all available pipelines offered by the Dextrus application.
- Select the Pipeline option from the drop-down list.
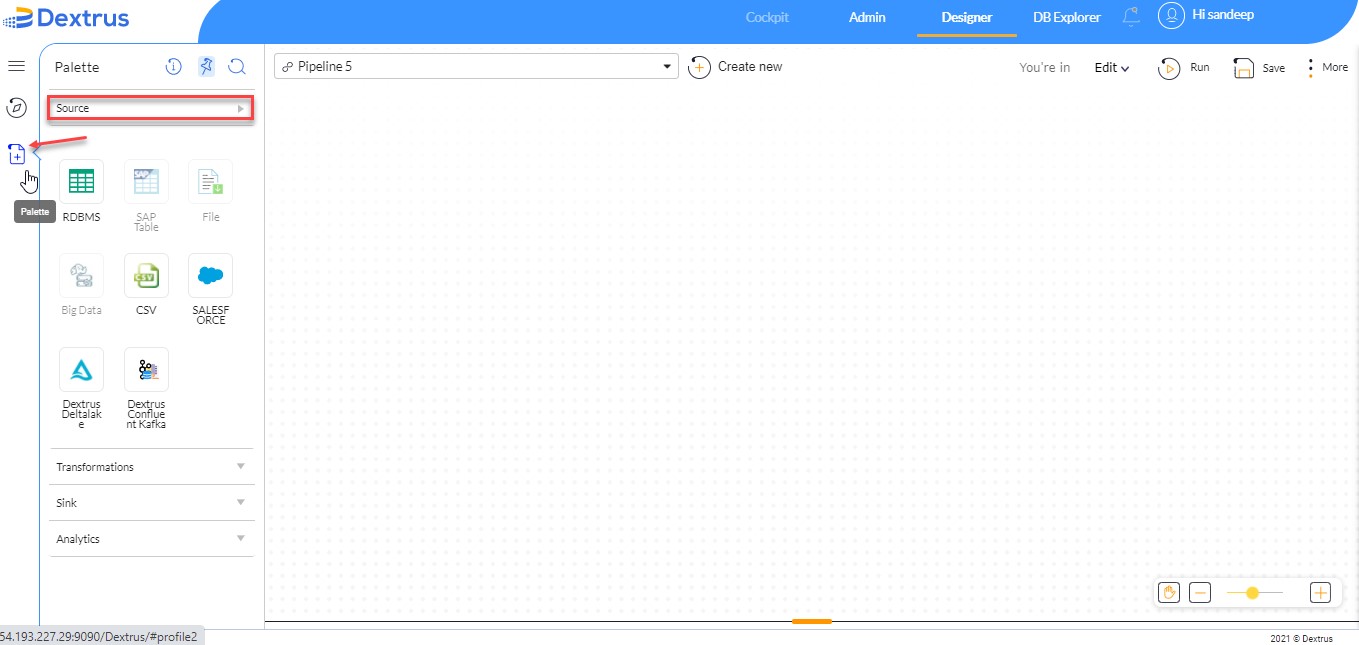
- Navigate to the left pane of the homepage, where you find three options arranged vertically namely Collapse, Explorer and Palette.
- Click the
 palette icon to view the Source, Transformations, Sink, and Analytics drop-down list options.
Note: When you click the Palette the Source drop-down list is displayed by default.
- Drag and drop the RDBMS source node onto the Dextrus canvas section.
- Tap on the RDBMS node to configure the connection.
- The Configuration option (radio button) is enabled by default.
- The Connection tab is highlighted with an orange color underline. This tab comprises Existing Connection, New Connection, and Recently Used tabs displayed vertically.
- Existing Connection: Displays the list of already existing connections with Type, Name, and Category details specified.
- New Connection: A new connection enables you to choose a database from the Databases available in the application.
- Recently Used: The most recently used connections are displayed here.
Note: The Existing Connection tab is selected by default. Highlighted with an orange color left indication arrow.
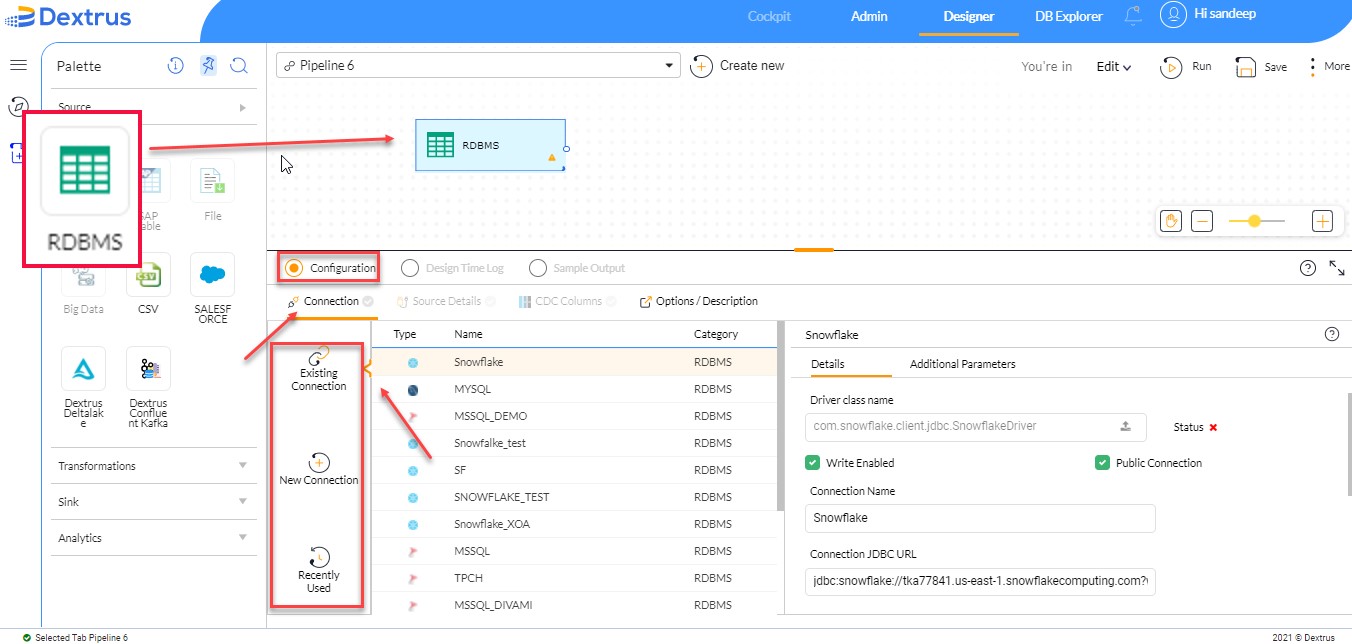
To demonstrate our use case to create a pipeline using “RDBMS-Filter-Dextrus Deltalake” nodes. Let us consider an existing connection (Snowflake).
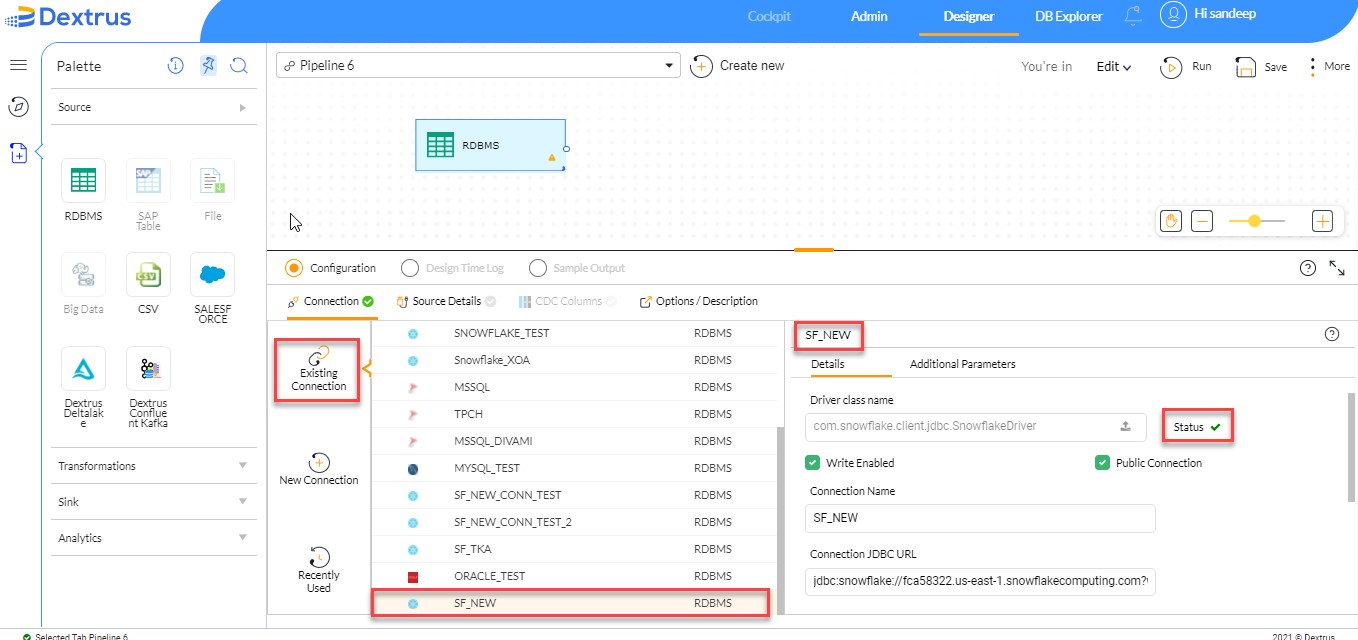
- Select the “SF_NEW” existing connection from the existing connection list.
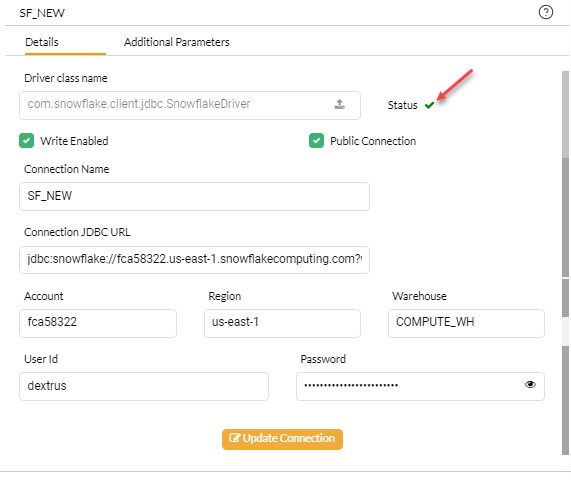
- If the connection is valid and active then a green tick mark is displayed beside Status.
Note: All the details populated for the “SF_NEW” connection are obtained when the new connection was created by the user previously. (Hint: Driver class name, Connection JDBC URL, Account, Region, Warehouse, and User id information details are to be filled by the user.)
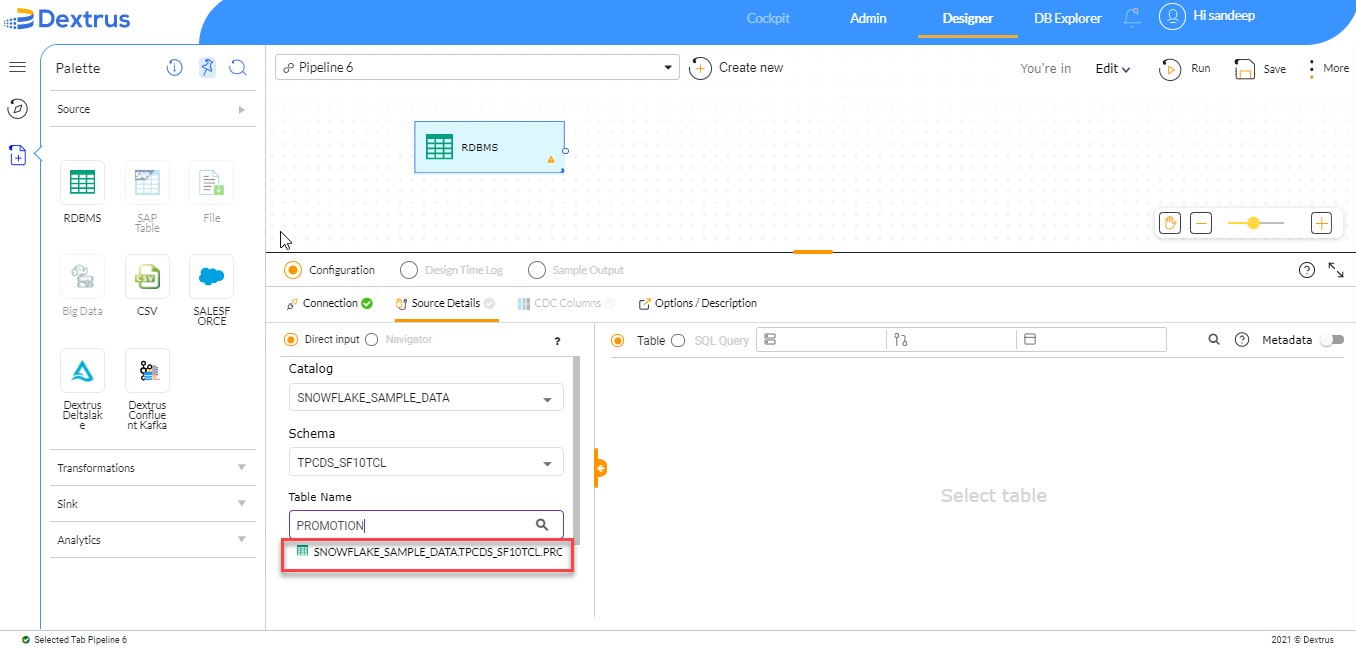
- Click the Source Details tab to provide input.
- Source Details comprises Direct input and Navigator options.
Note: Direct input radio button is selected by default.
- Select the “SNOWFLAKE_SAMPLE_DATA” option from the Catalog drop-down list.
- Select the “TPCDS_SF10TCL” option from the Schema drop-down list.
- Type a table name “PROMOTION” and click Enter from the keypad or click the
 icon to search for the typed table name.
 - Click the generated table name.
- The table of records is displayed specifying the column names and other properties.
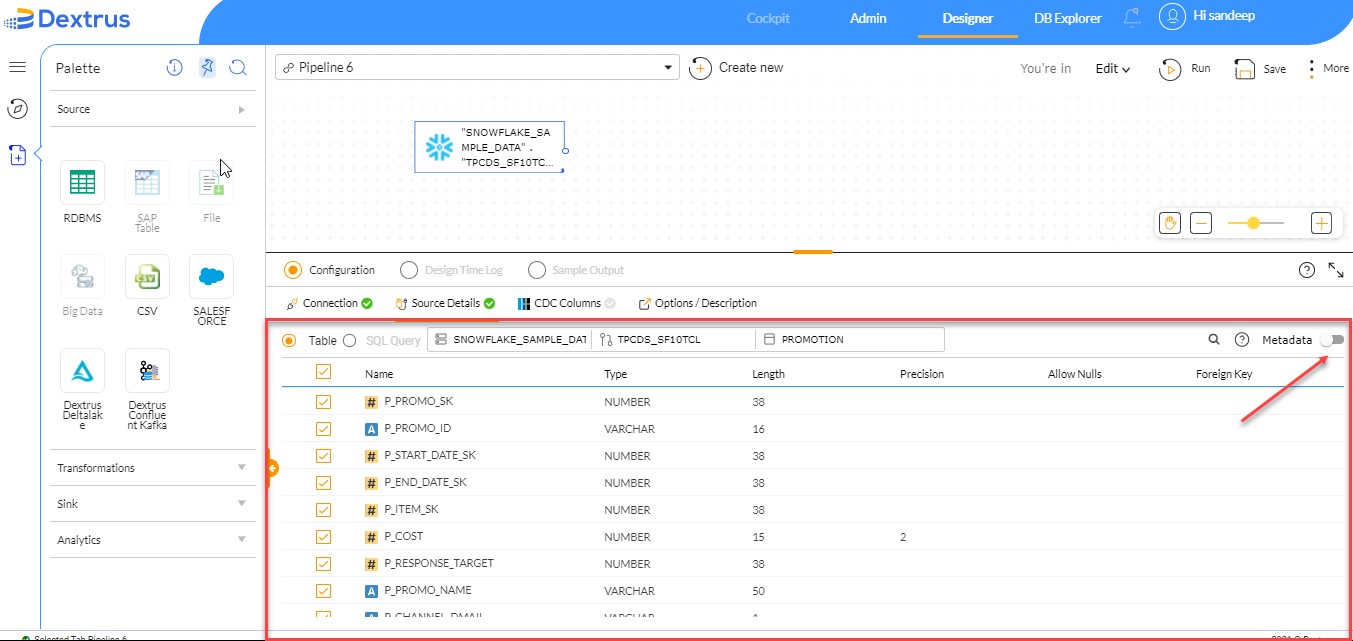
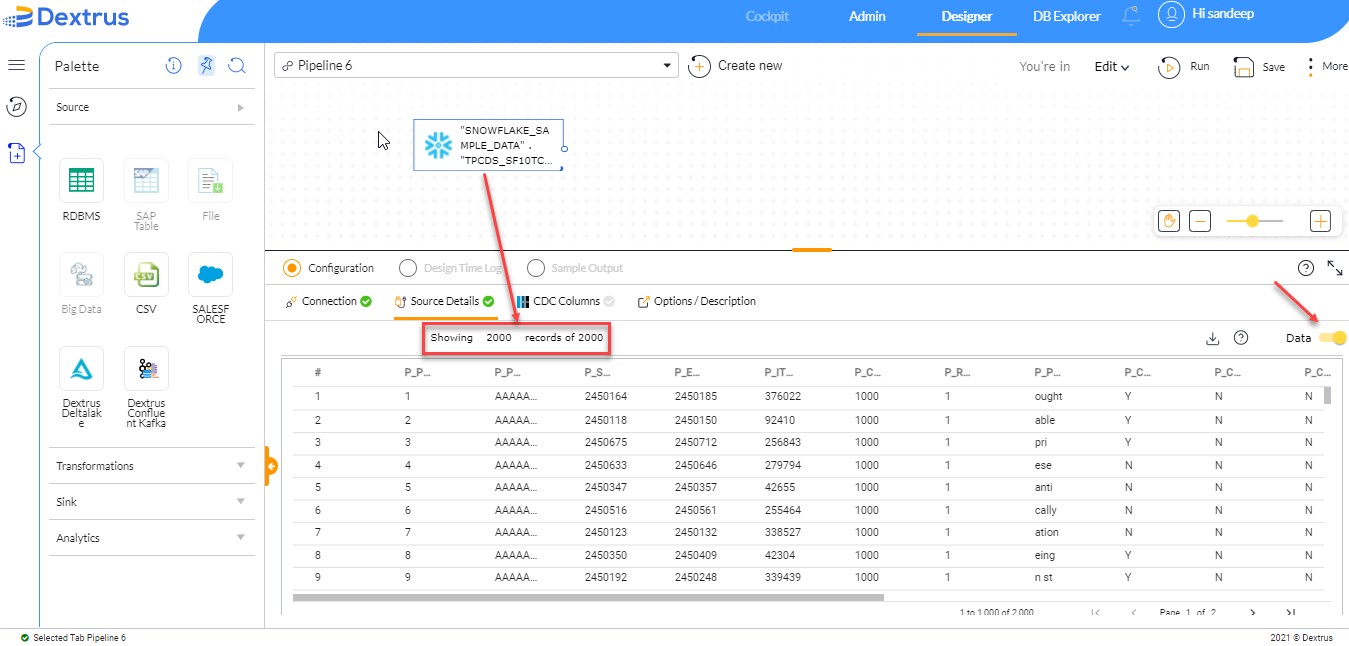
- Click the Metadata toggle button to see complete table records information.
- Click the Data toggle button again to switch back to the metadata page.
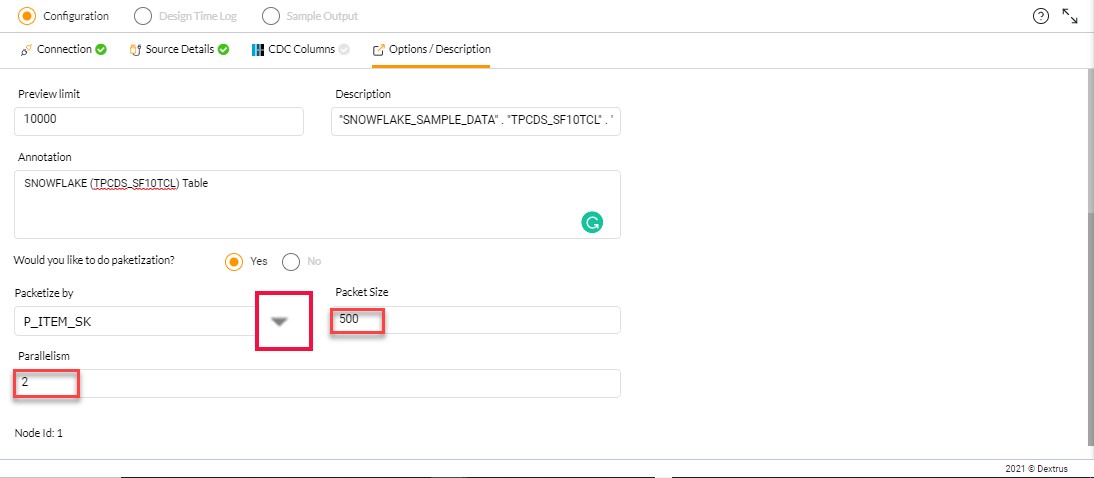
- Click the Options / Description tab.
- Set the Preview limit with a value of 10000.
- The description field is populated with table details, in our use case it is "SNOWFLAKE_SAMPLE_DATA". "TPCDS_SF10TCL" . "PROMOTION".
- The packetization helps you to process data at a faster rate. Choose the ‘Yes’ radio button to allow packetization.
- Set the packet size with a value of 500.
- Set the parallelism with a value of 2 to process the data parallelly.
- Click the Sample Output to see the number of records displayed on top of the RDBMS node. In our case, it is 2000 records.
- Navigate to Transformations available in the palette.
- Drag and drop the Filter node onto the Dextrus canvas section.
- Create a pipeline by connecting the output port of the RDBMS node to the input port of the Filter node.
- Tap on the Filter node to configure the connection.
- The Configuration option (radio button) is enabled by default.
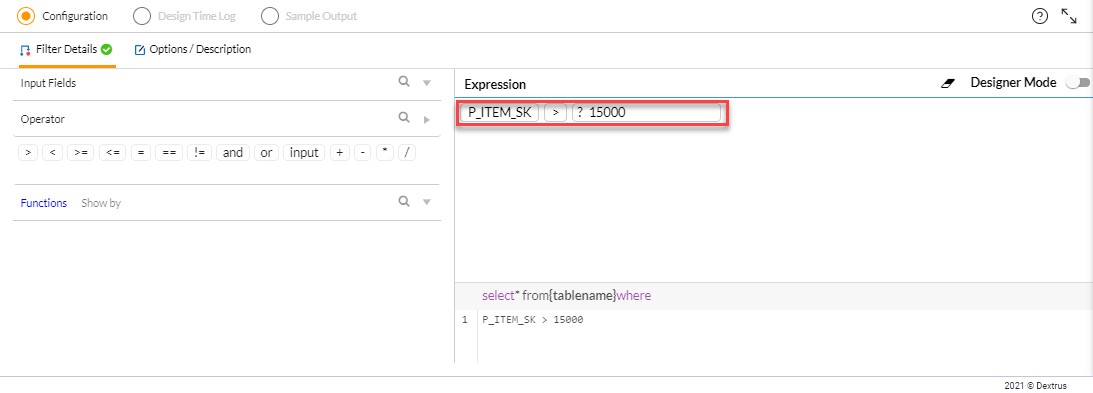
- The Filter Details tab is highlighted with an orange color underline. This tab comprises Input Fields, Operator, and Functions.
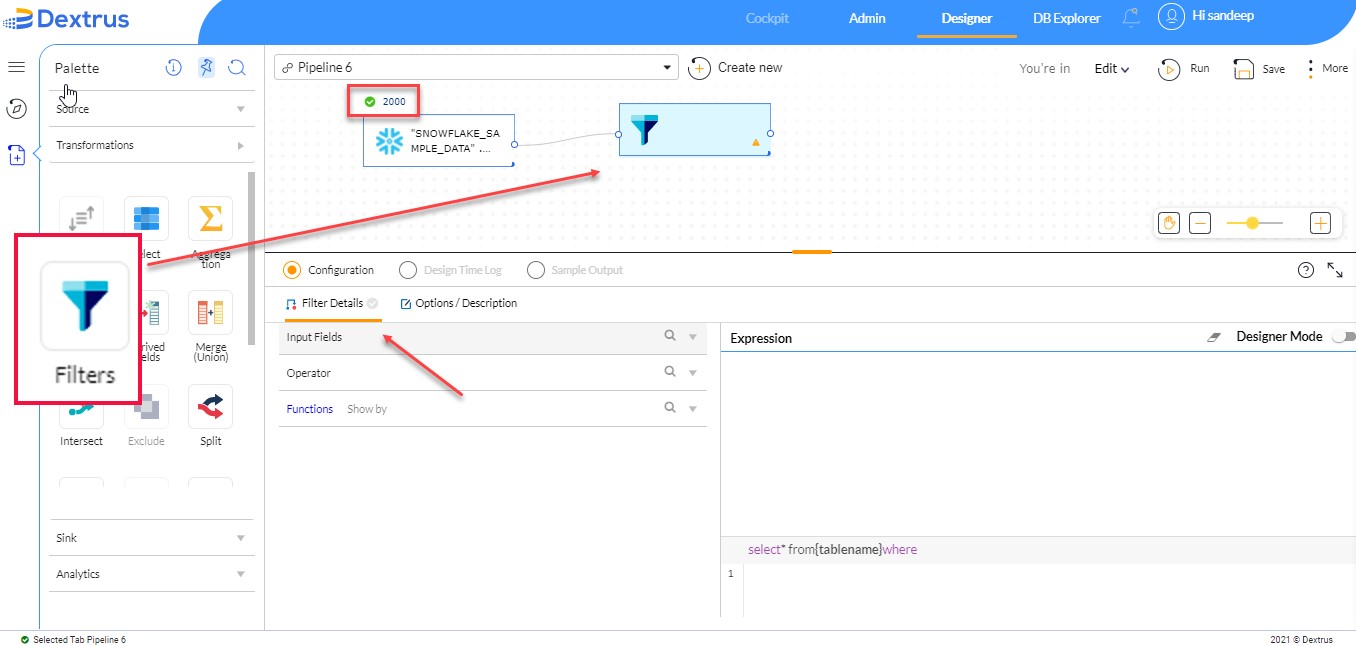
- Click the Collapse/Expand drop-down button to view the input fields. The input fields are populated from the “SF_NEW” connected source node.
- Drag and drop the “P_ITEM_SK” input field onto the Expression section.
- Click the Collapse/Expand drop-down button to view the list of operators.
- Drag and drop the operator “>” onto the Expression section.
- Drag and drop the input operator onto the Expression section and enter a value of 15000.
- The filter condition is defined as “P_ITEM_SK > 15000” in the Expression section.
- Navigate to the Sink available in the palette.
- Drag and drop the Dextrus Deltalake node onto the Dextrus canvas section.
- Create a pipeline by connecting the output port of the Filter node to the input port of the Dextrus Deltalake node.
- Tap on the Dextrus Deltalake node to configure the connection.
- The Configuration option (radio button) is enabled by default.
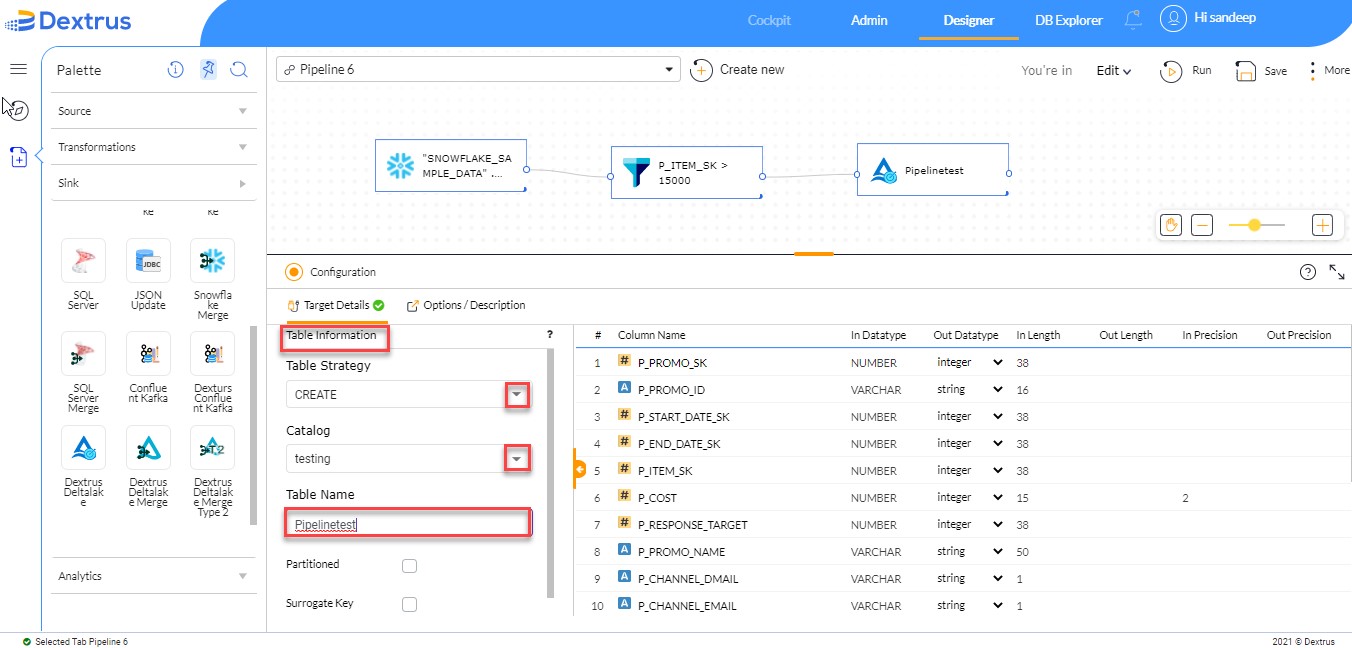
- The Target Details tab is highlighted with an orange color underline.
- Select the “CREATE” option from the Table Strategy drop-down list.
- Select the “testing” option from the Catalog drop-down list.
- Type the table name as “Pipelinetest”.
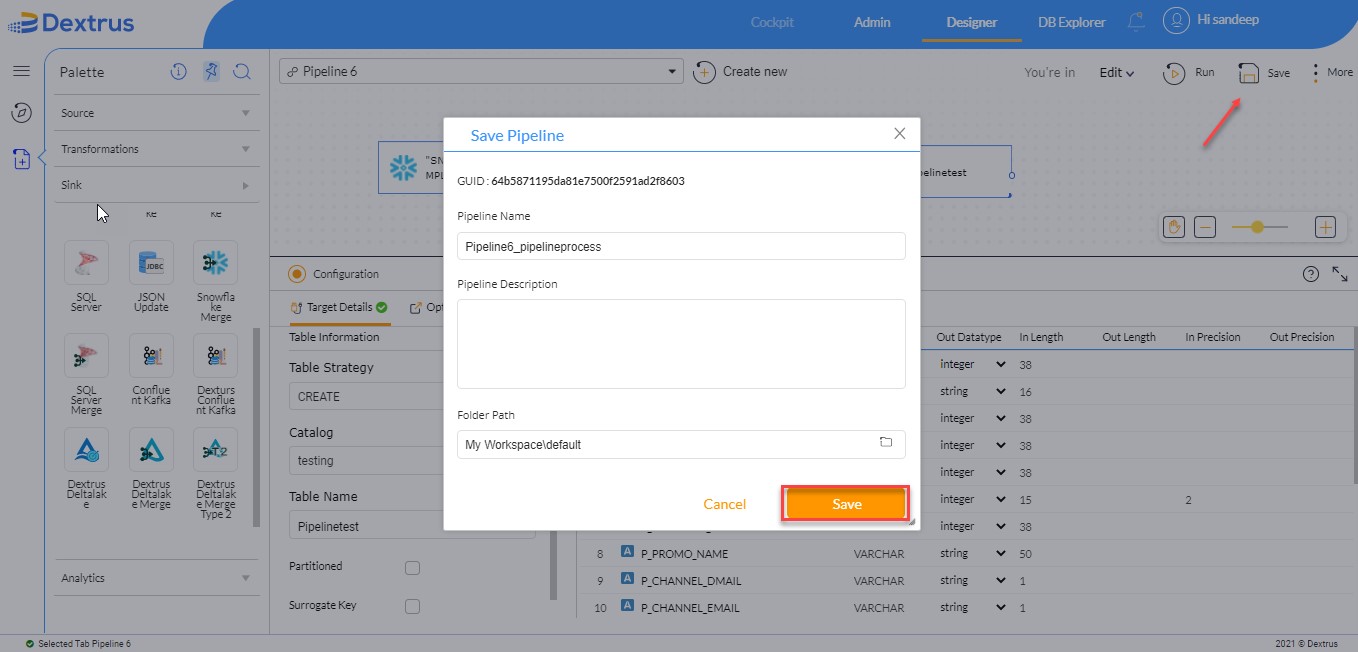
- Before running the created pipeline, the pipeline should be saved. Click the Save button.
- A Save Pipeline pop-up window is populated on the screen.
- Name the pipeline with a unique name and click the Save button to save the pipeline.
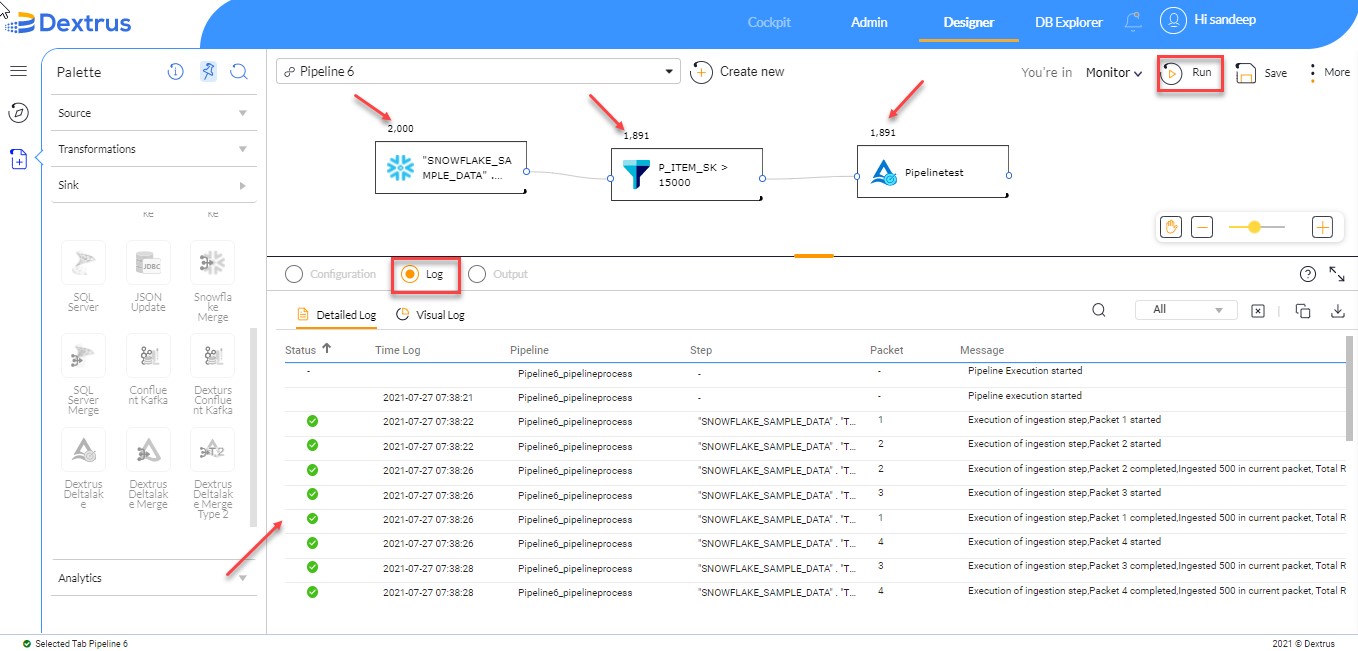
- Click the Run button to compile the pipeline.
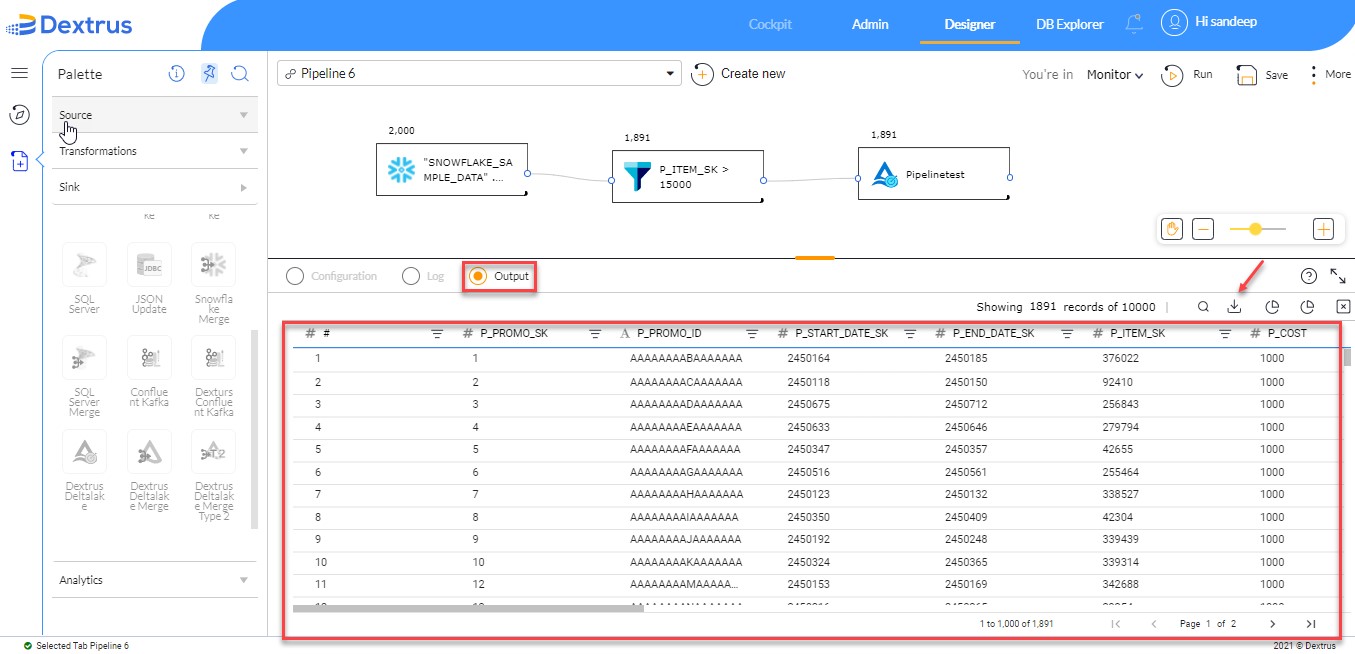
- The moment when the compilation process begins the log window appears at the bottom of the screen with the Log radio button selected.
- The status (green/red) of each compiled time log is captured and displayed on the screen.
- The number of output records processed at each node is displayed on the top of the node connected in the pipeline.
- Select the Output radio button to see the records transformed from RDBMS to Dextrus Deltalake through the Filter node.
- Click the
 icon to export the records into Excel/CSV files.
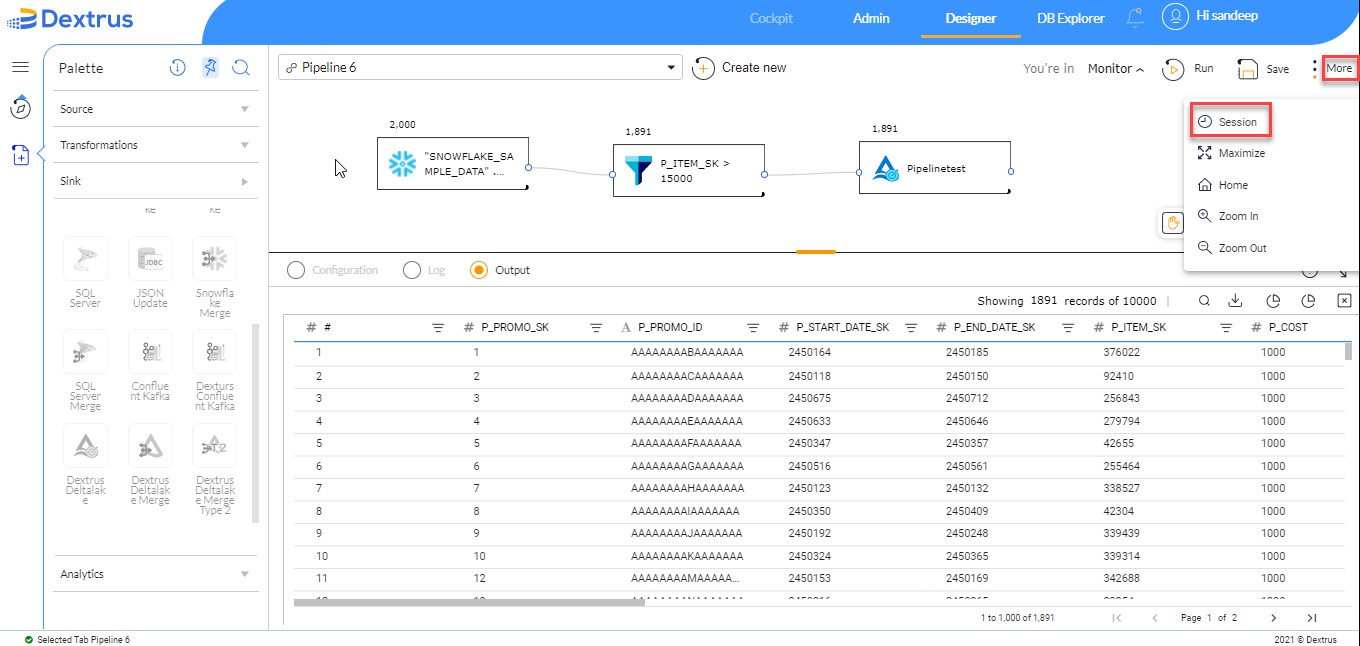
- Navigate to the More option on the top right corner of the screen.
- Click the More button to see the list of options “Session, Maximize, Home, Zoom In, and Zoom Out.
- Select the Session option from the list to view the session history of the created pipeline.
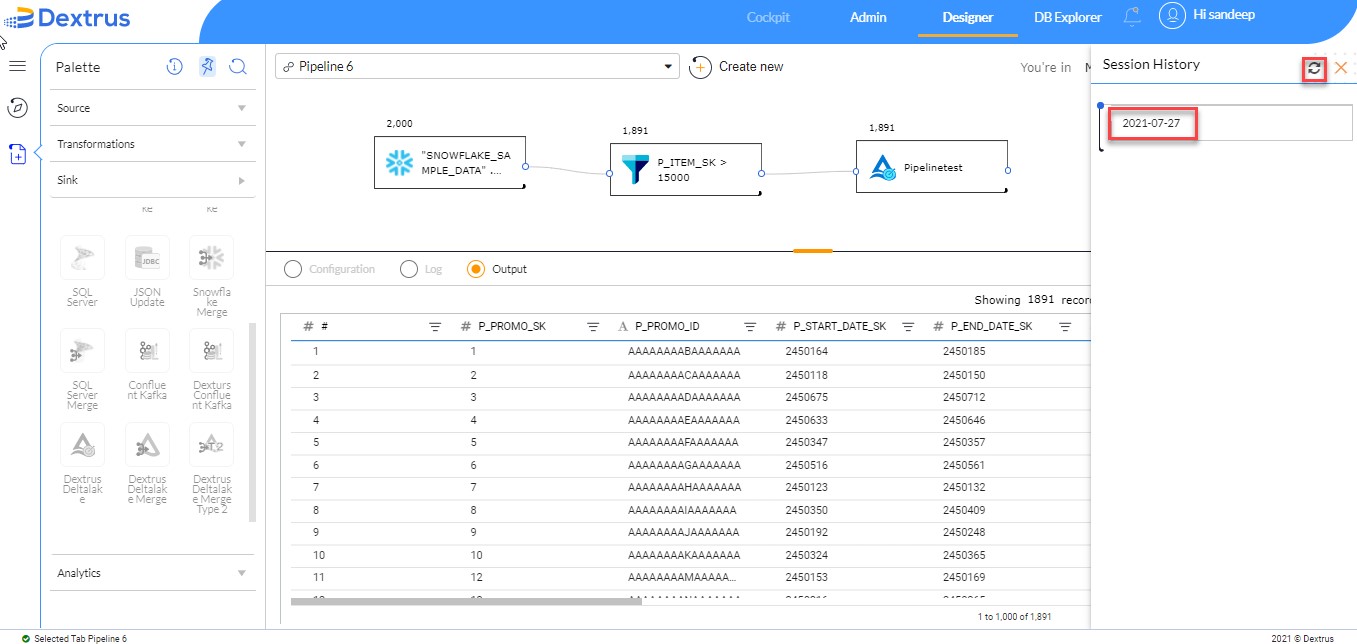
- The session history slide window appears on the screen.
- For the created pipeline the session history displays the date in (yyyy-mm-dd) format.
- Click the
 icon to refresh the session history.
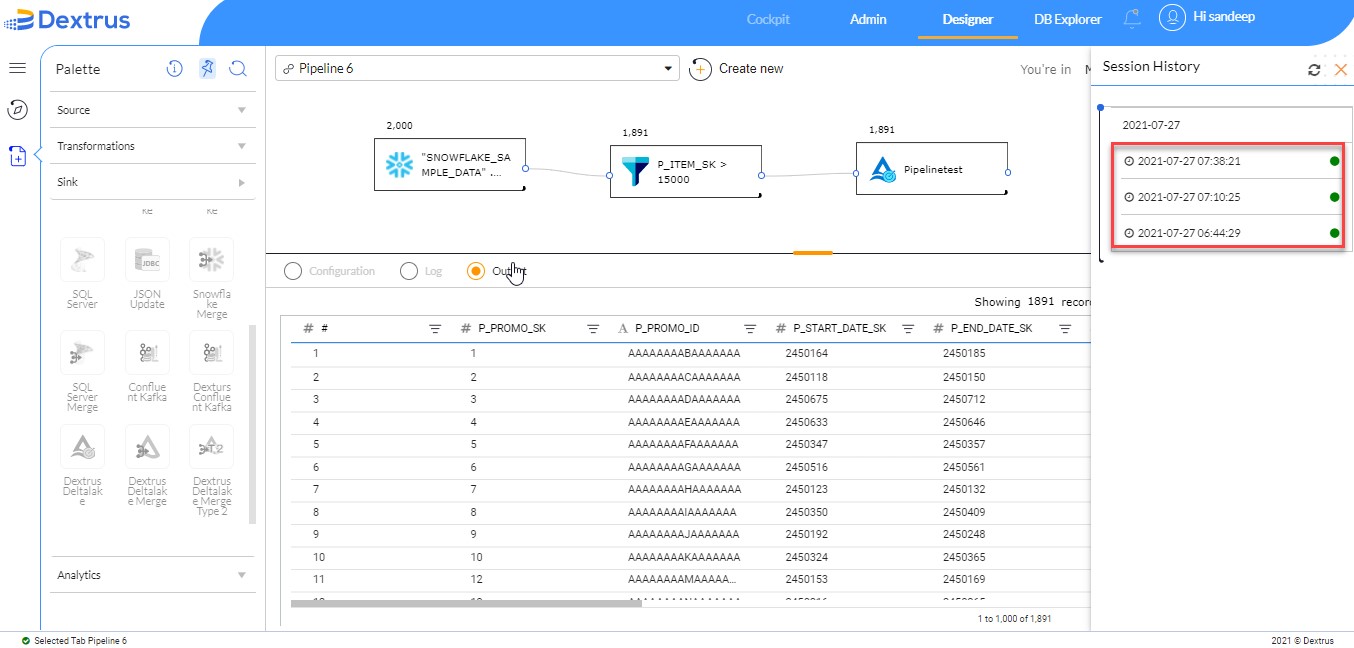
- Click the date to view all the sessions recorded in detail.
- Each session displays the date along with the timestamp and completion status.
Note: Once the compiling process is successfully run and completed the application goes into the Monitor view restricting the user to make any changes.
- Click the
 icon to close the Session History slide window.
 - Navigate to Monitor drop-down list option and click the drop-down icon to change to the Edit view to enable and access all nodes in the application.