This user guide walks you through the Dextrus Query-based CDC (Batch Pipeline) and Bulk Data Pipeline (Initial Load).
- Login to the Dextrus application with the provided credentials.
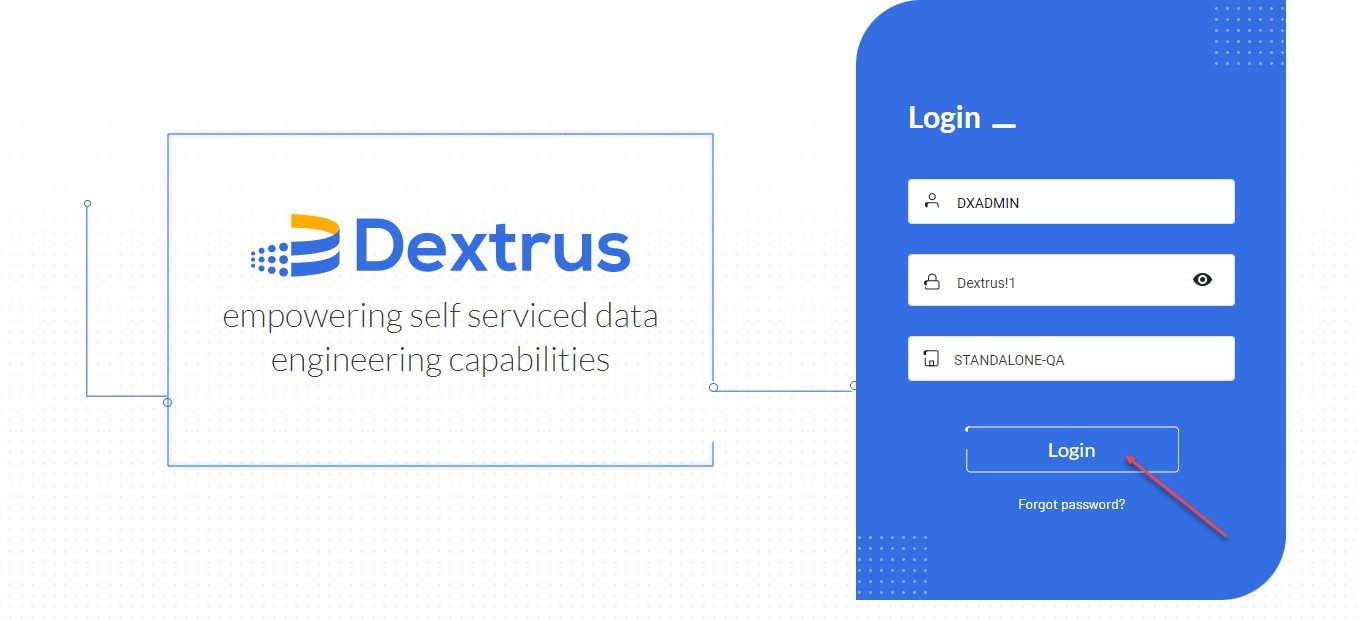
- Click the Login button.
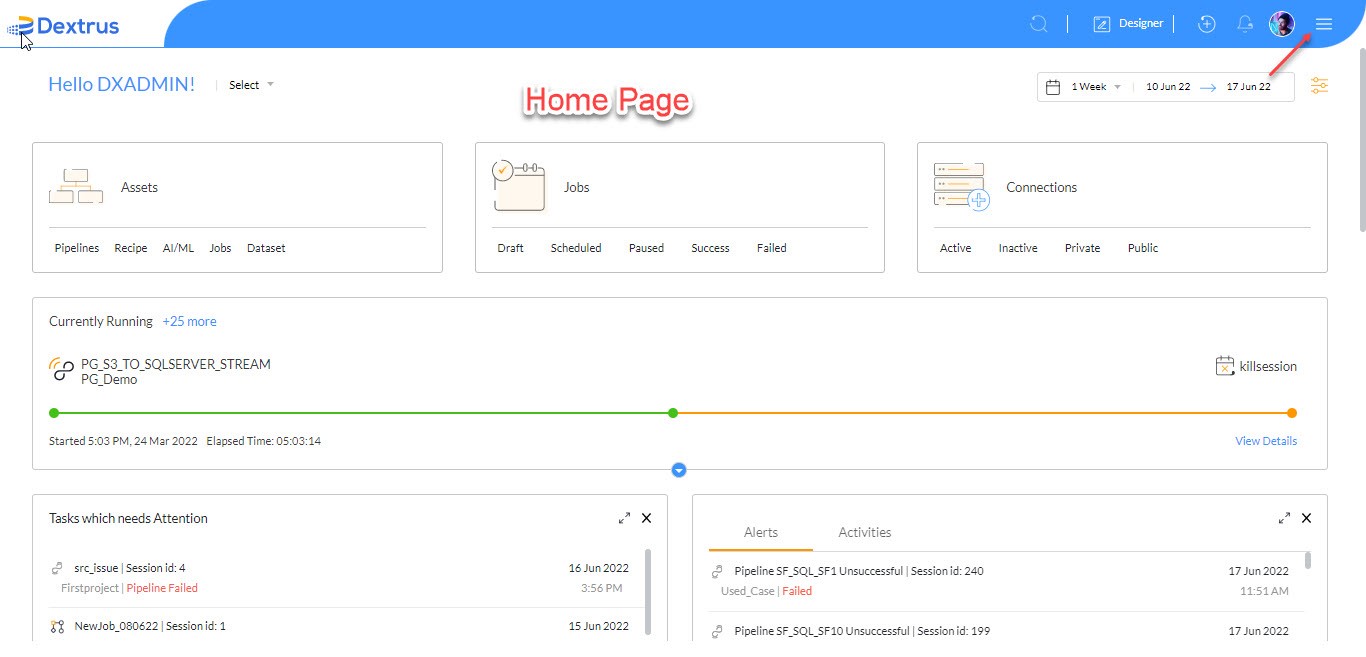
- Once the application authenticates the user credentials. Dextrus home page is displayed.
- Click the hamburger menu on the top right corner of the Home page to access Pipeline Designer or else directly click the Designer on the Dextrus tool bar.
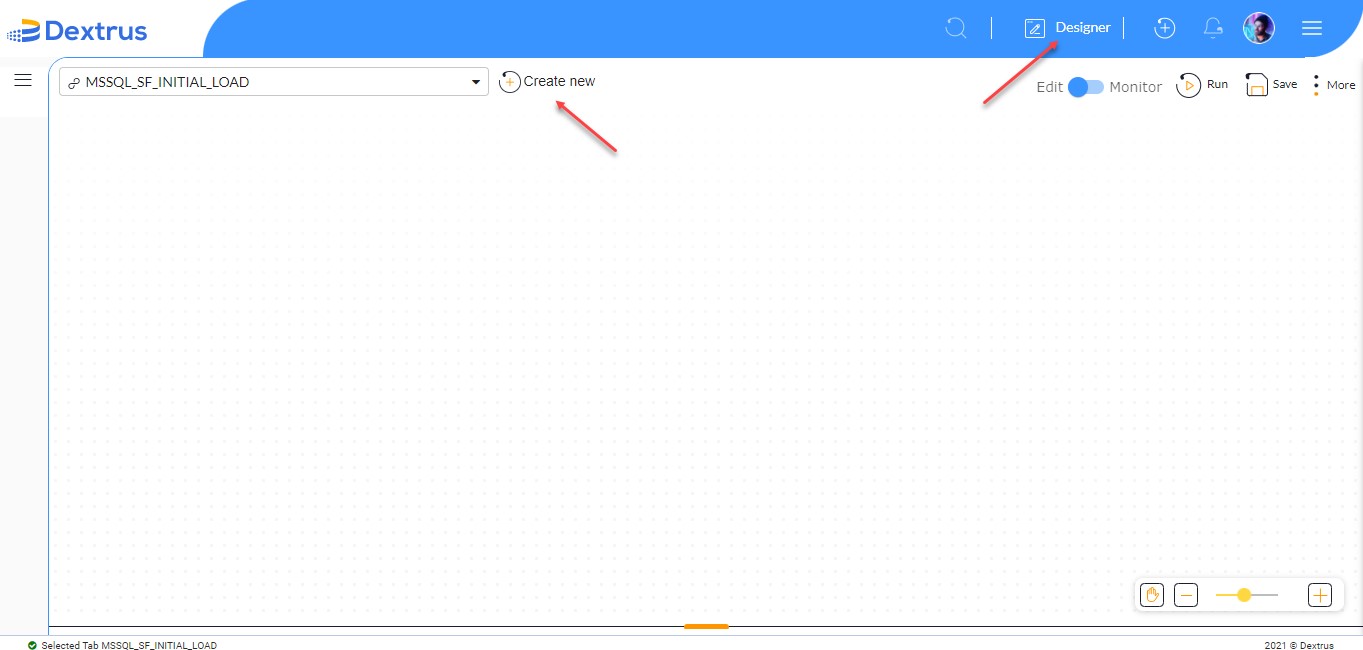
- Now, you land on the Designer page of the Dextrus application where you create a Pipeline of your choice.
- Click + Create new button beside the drop-down list.
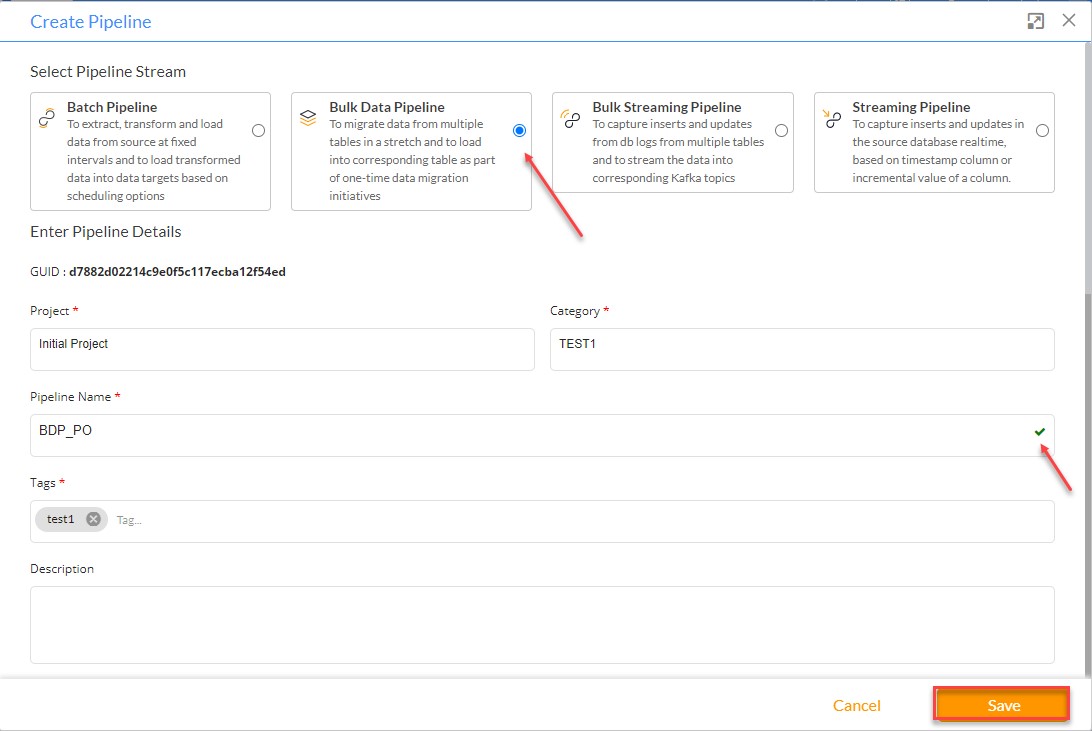
- A Create Pipeline pop-up window is displayed.
Note: Initially, the Bulk Data Pipeline is selected to perform the initial load from SAP HANA to the SQL Server systems. Later, we select the Batch Pipeline to perform incremental loads using the CDC (Change Data Capture) Columns feature.
- Select the Bulk Data Pipeline radio button.
- Enter Pipeline Details, by typing Project, Category, Pipeline Name, Tags, and Description details in their respective text fields.
Note: Make sure you fill in all the Pipeline details since asterisk-marked fields are mandatory to be filled in to proceed further. The Description text field is optional.
- Click the Save button to save the Pipeline details.
- A green color tick mark status is displayed in the Pipeline Name text field indicating the pipeline name is available for use.
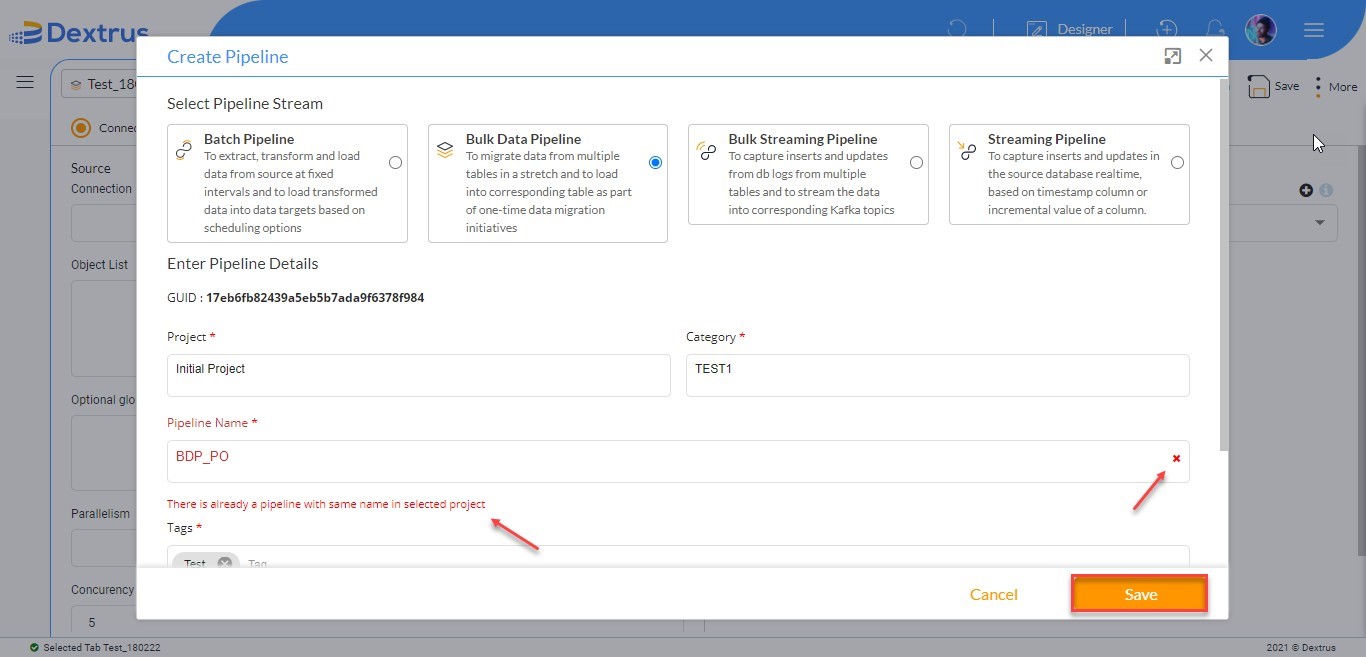
- In case you type an existing pipeline name, a warning message appears as "There is already a pipeline with the same name in the selected project".
- A red color cross mark status is displayed in the Pipeline Name text field indicating the pipeline name is not available for use.
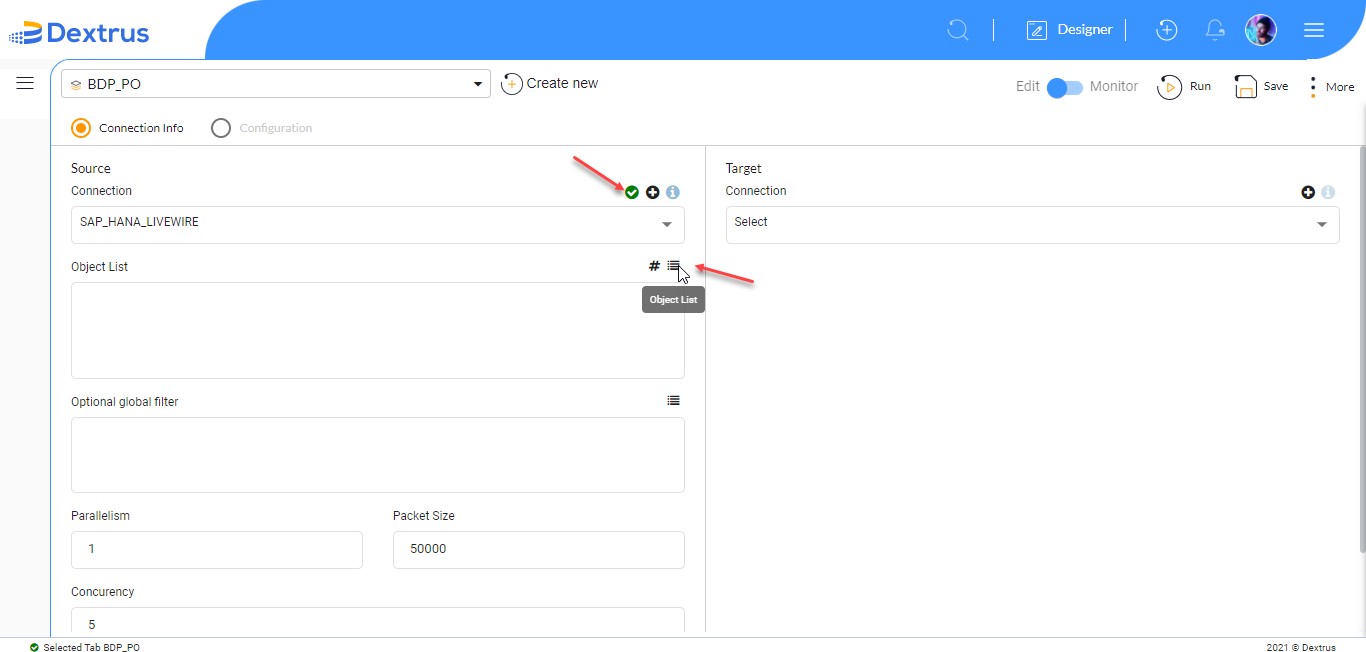
- The Bulk Data Pipeline (BDP) Connection Info screen is displayed. Where the Connection Info radio button is selected by default.
- The Connection Info screen is partitioned into Source and Target sections.
- Select the SAP_HANA_LIVEWIRE connection name from the Source Connection drop-down list.
- A green color tick mark appears if the selected connection name is active.
Note: You can hover on the icons to know their naming convention.
- Click the Object List icon to select tables of the selected connection.
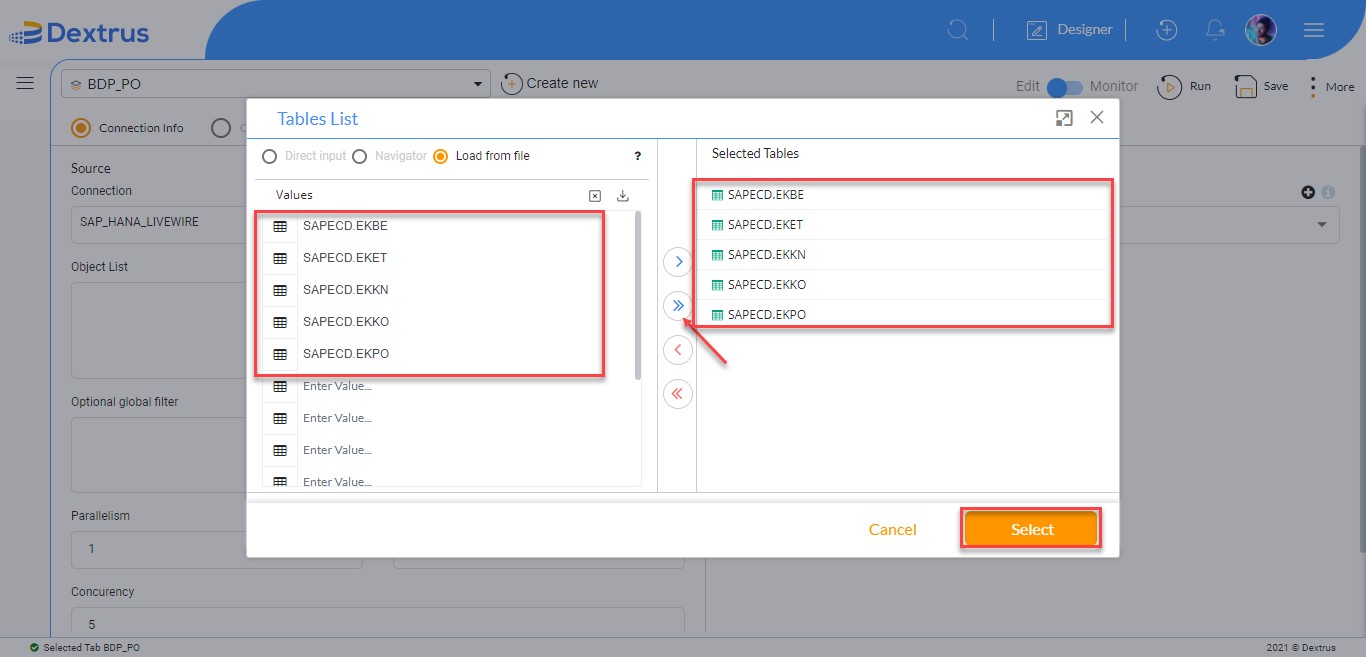
- A Tables List pop-up window is displayed, where Direct Input, Navigator, and Load from file radio buttons are available.
Note: In our use case we are considering the Load from file option to load tables.
- Select the Load from file radio button.
- Click the Import from file icon to browse and import tables from the selected notepad
- Click the ‘>>’ icon to select all tables and move them to the right side pane section under 'Selected Tables'.
Note: You can either select the '>' icon to only move selected tables. Moreover, the '<' icon can be used to unselect only the required tables, and the '<<' icon is used to unselect all tables and move them back to the Values section.
- Click the Select button to confirm the selected tables.
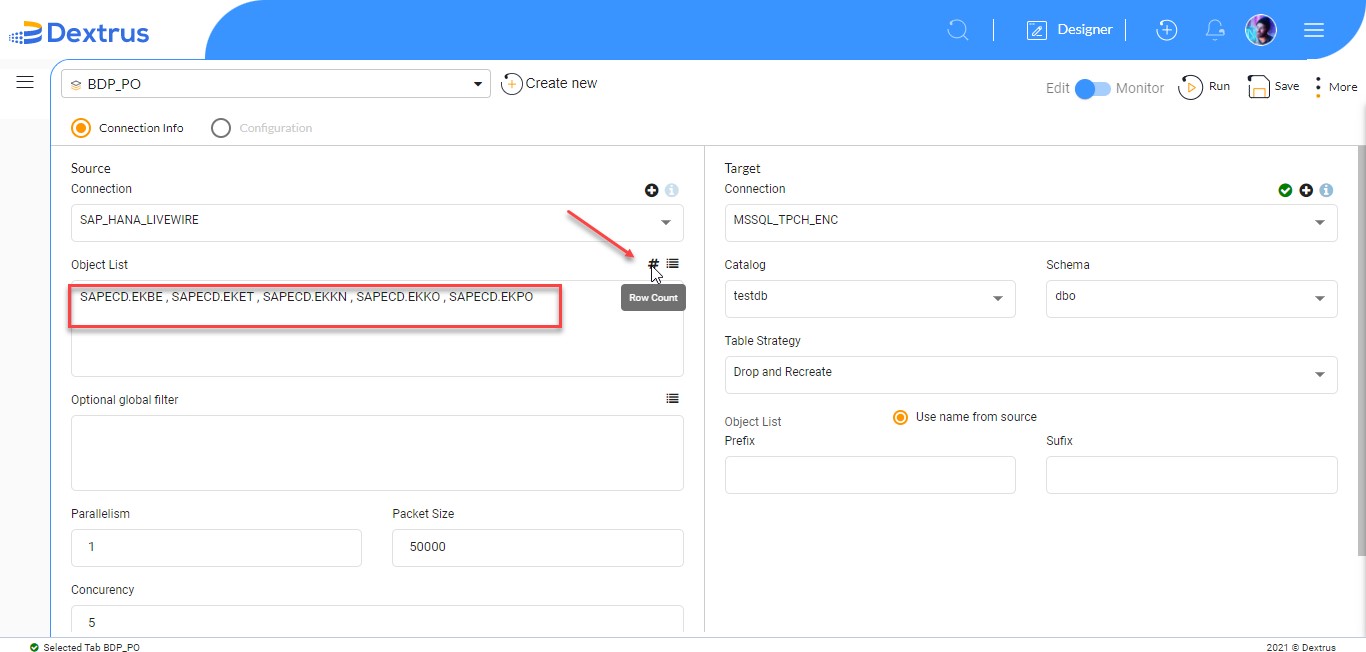
- The selected tables are displayed in the Object List text box.
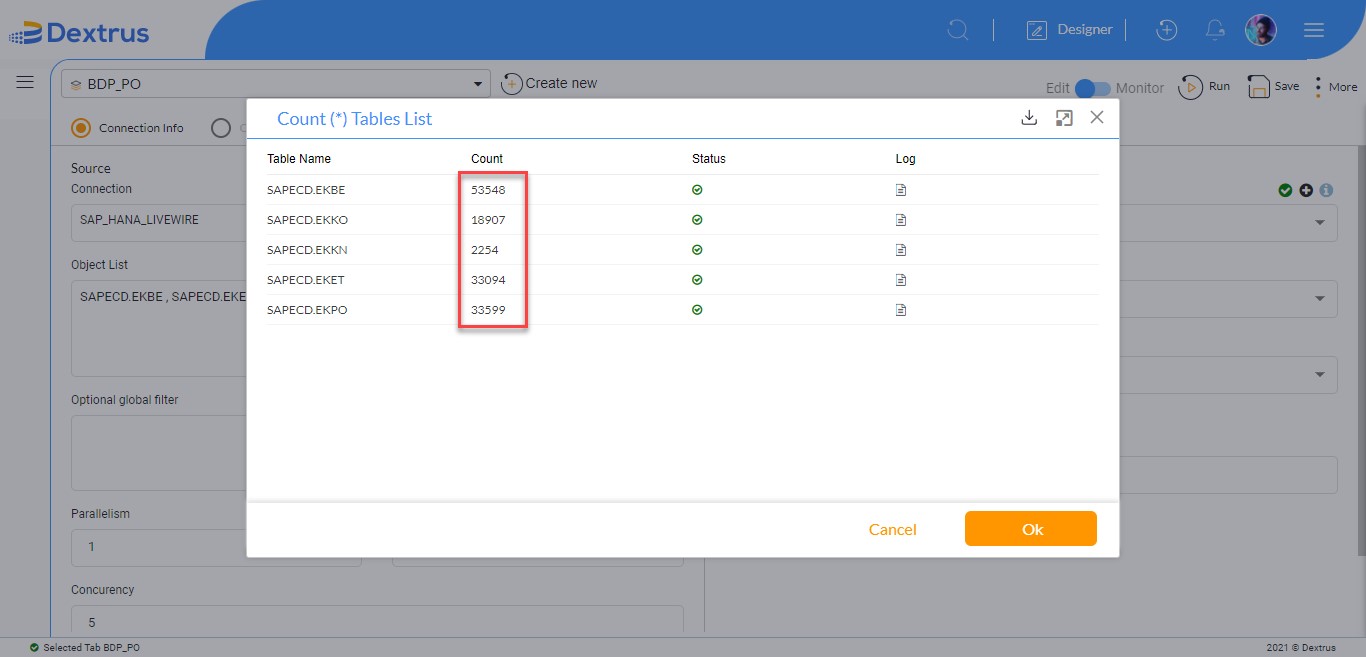
- Click the Row Count icon beside the Object List icon to view the individual row count of each table.
- A Count (*) Tables List pop-up window is displayed. The count of each table is displayed under the Count column.
- Click the Ok button to close the pop-up window.
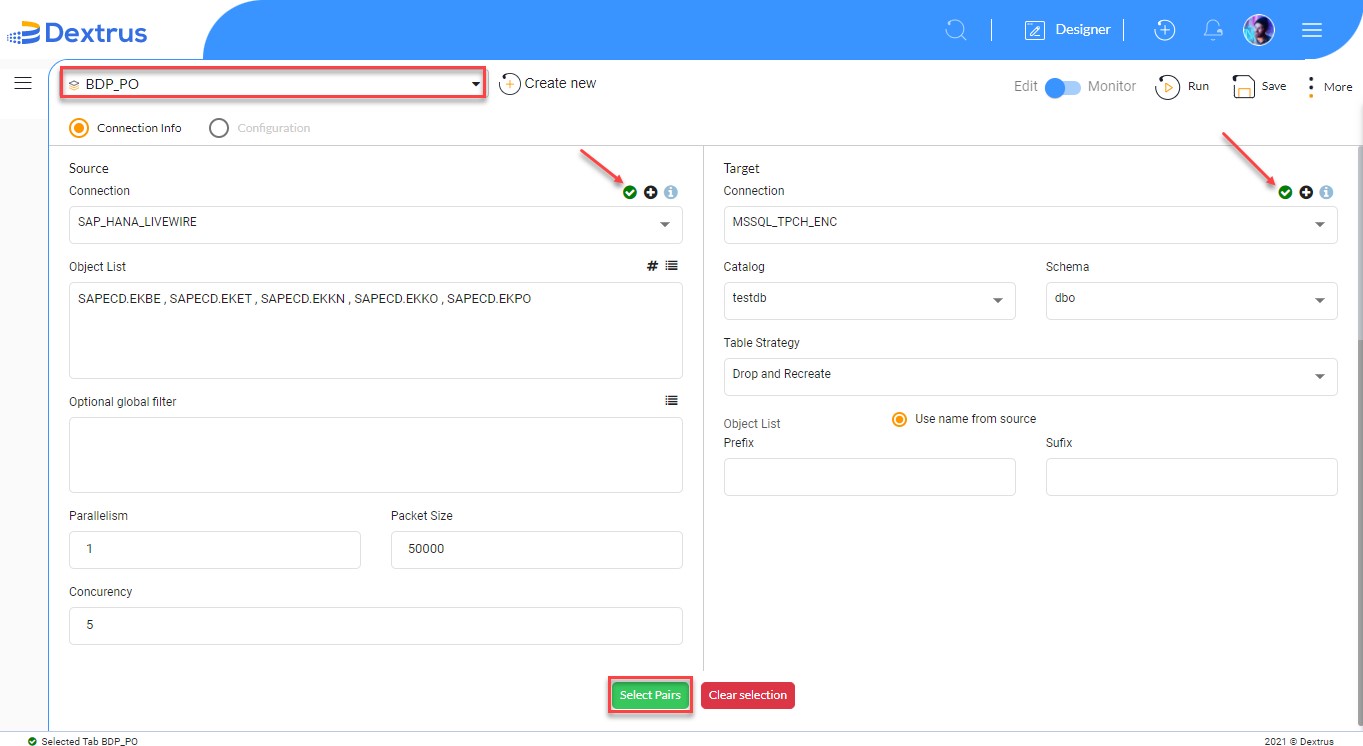
- In the Connection Info screen, you need to fill in Parallelism, Packet Size, and Concurency fields under the Source section.
Note: Default values are auto-populated for Parallelism, Packet Size, and Concurency fields.
- Selectthe'MSSQL_TPCH_ENC'connectionfromthetargetconnectiondrop-down
- Select the 'testdb' catalog option from the Catalog drop-down list.
- Select the 'dbo' schema option from the Schema drop-down list.
Note: A search box is provided to search for any required name as you open the drop-down list.
- Select the 'Drop and Recreate'table strategy option from the Table Strategy drop-down list.
Note: You can see four options namely Create, Append, Truncate and Drop and Recreate under the Table Strategy drop-down list.
- The Use name from the source radio button is selected, by default.
- The Prefix and Sufix text fields are optional for you to specify.
Note: The Prefix and Sufix fields under Object List are provisioned to append a prefix and sufix text to the source Object List tables.
- Click the Select Pairs button to move ahead.
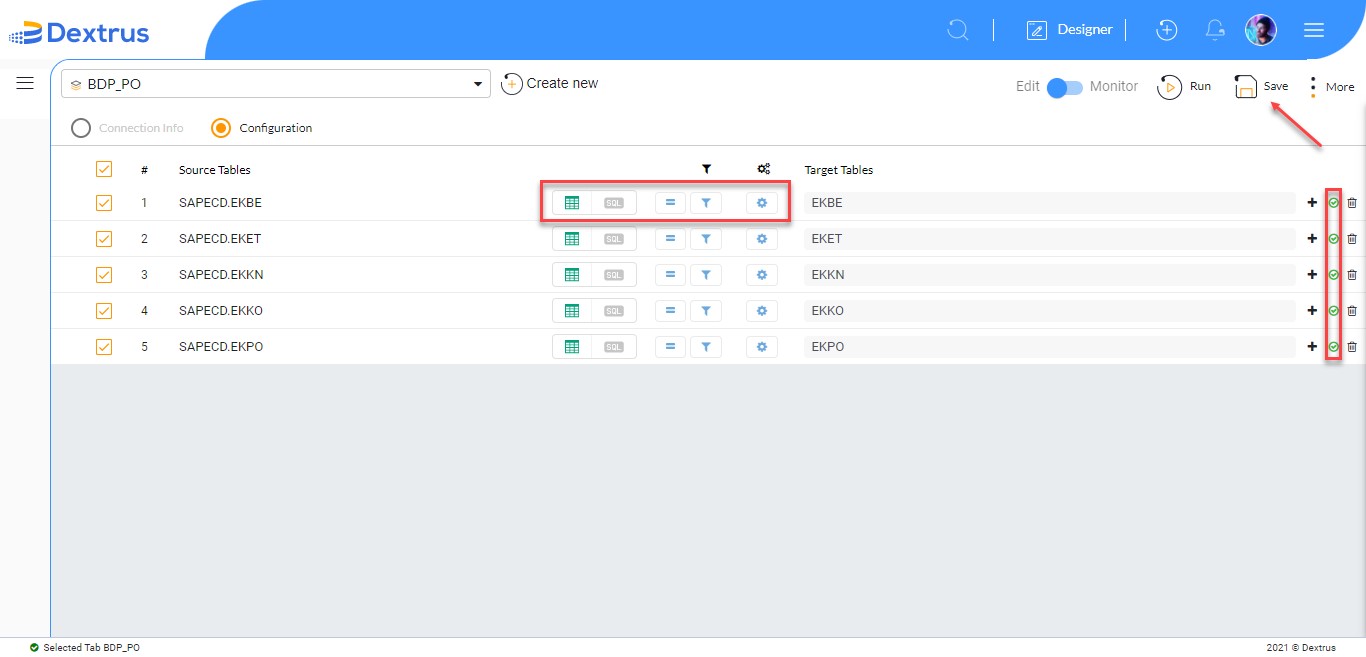
- The Configuration radio button is selected and the table details are displayed.
Note: The BDP configuration screen displays various components namely, Custom SQL, Local Filter, and Table Setting. Using Custom SQL and Local Filter you can refine the data as per your requirement. The Table Setting helps you to change the OutData type, Out Length, Out Precision, and other settings.
- The green color status against each table name indicates the source and target tables are configured properly.
Note: The Plus/Delete icons help you to add a new source table or delete an existing table.
- Click the Save button on the top right corner of the page to save the BDP settings again.
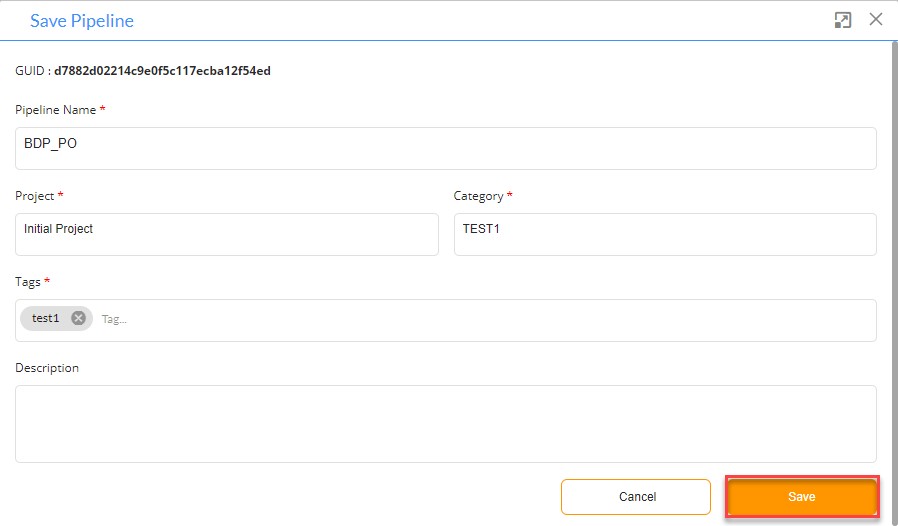
- A Save Pipeline pop-up window is displayed.
- Click the Save button on the Save Pipeline pop-up window.
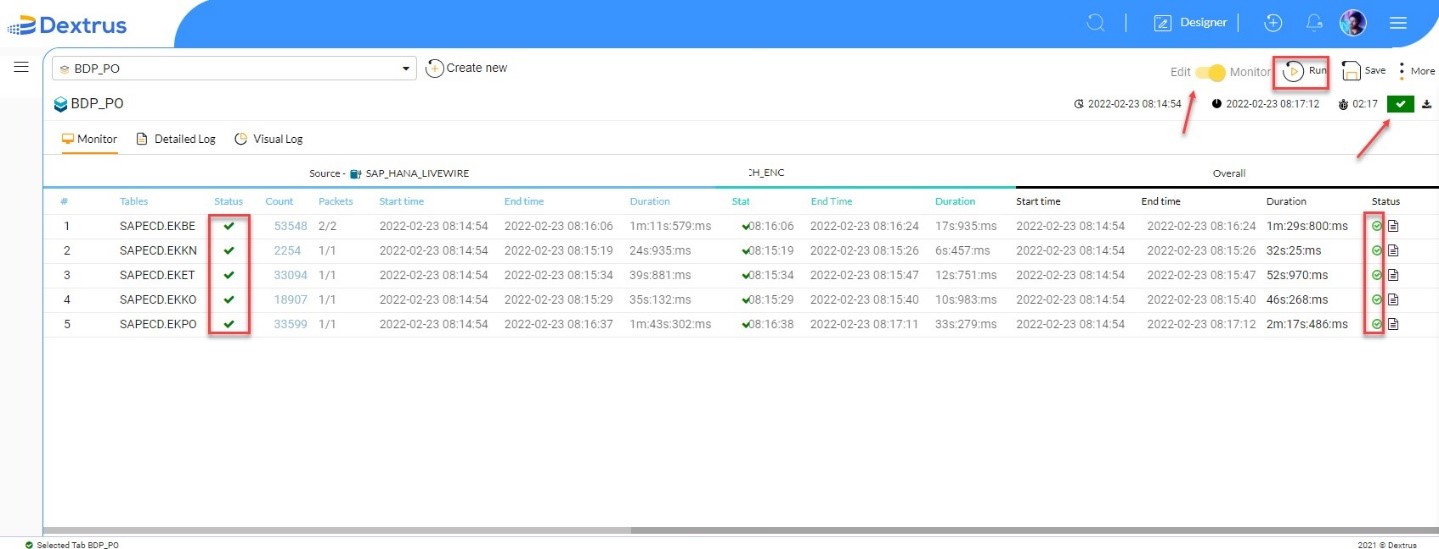
- Click the Run button beside the Save button to start the execution process.
Note: After you click the Run button the application goes to the Monitor mode, where you can’t make any changes in the pipeline. By default, the application is in the Edit mode where you create and configure the pipeline as per your requirements.
- A white color tick mark within the green color box status is displayed to indicate the successful execution of the pipeline (BDP_PO).
- A green color circle with a tick mark against each table indicates the source tables are successfully loaded into the target system.
Note: By default, the Monitor tab is displayed. You can click Detailed Log or Visual Log tabs for detailed information.
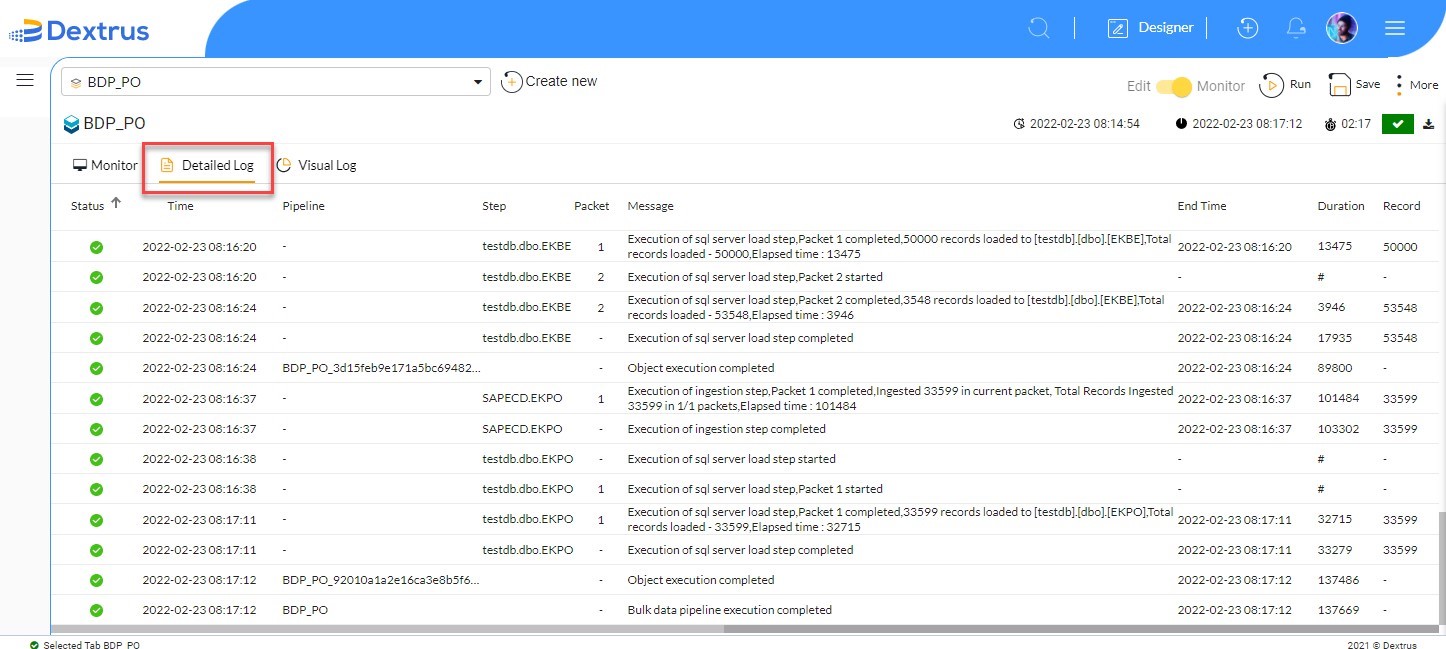
- Click the Detailed Log tab to get the detailed log information.
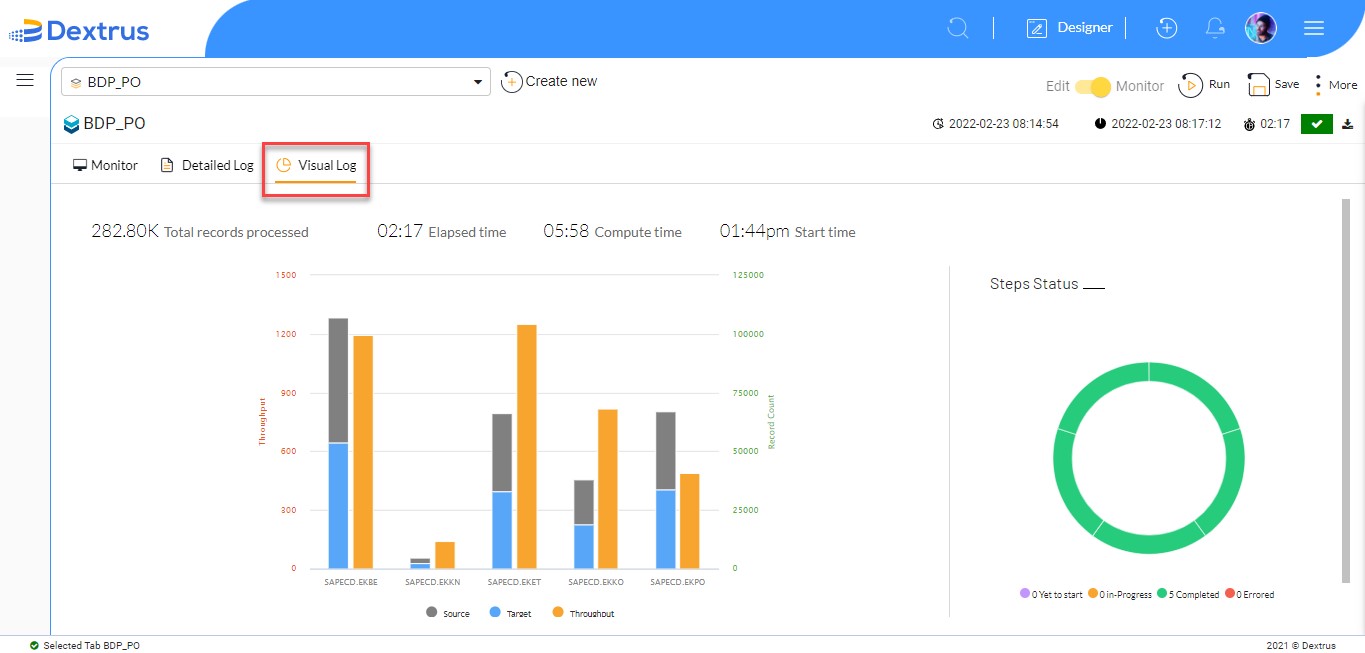
- Click the Visual Log tab to view generated logs information in the pictorial presentation.
Note: You can hover on the Bar graph and Steps Status to view specific table details.
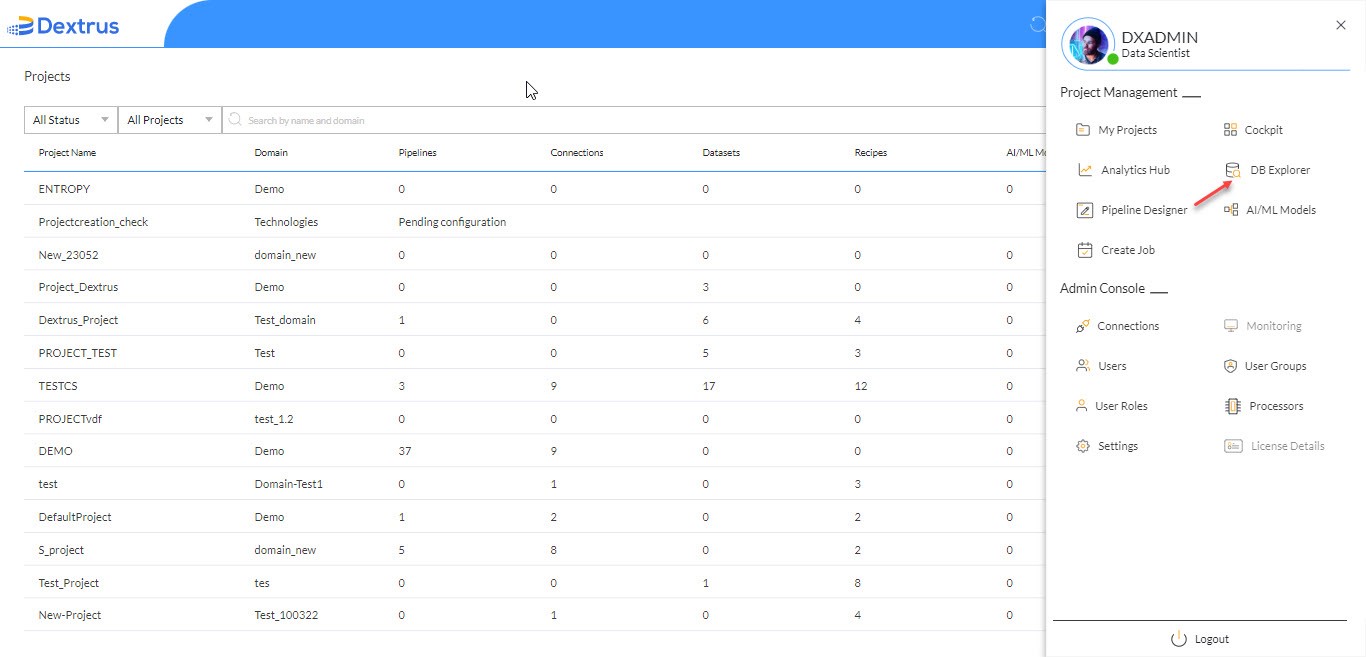
- Navigate to the hamburger menu and click the DB Explorer option.
- Click the
 icon to create a new sheet.
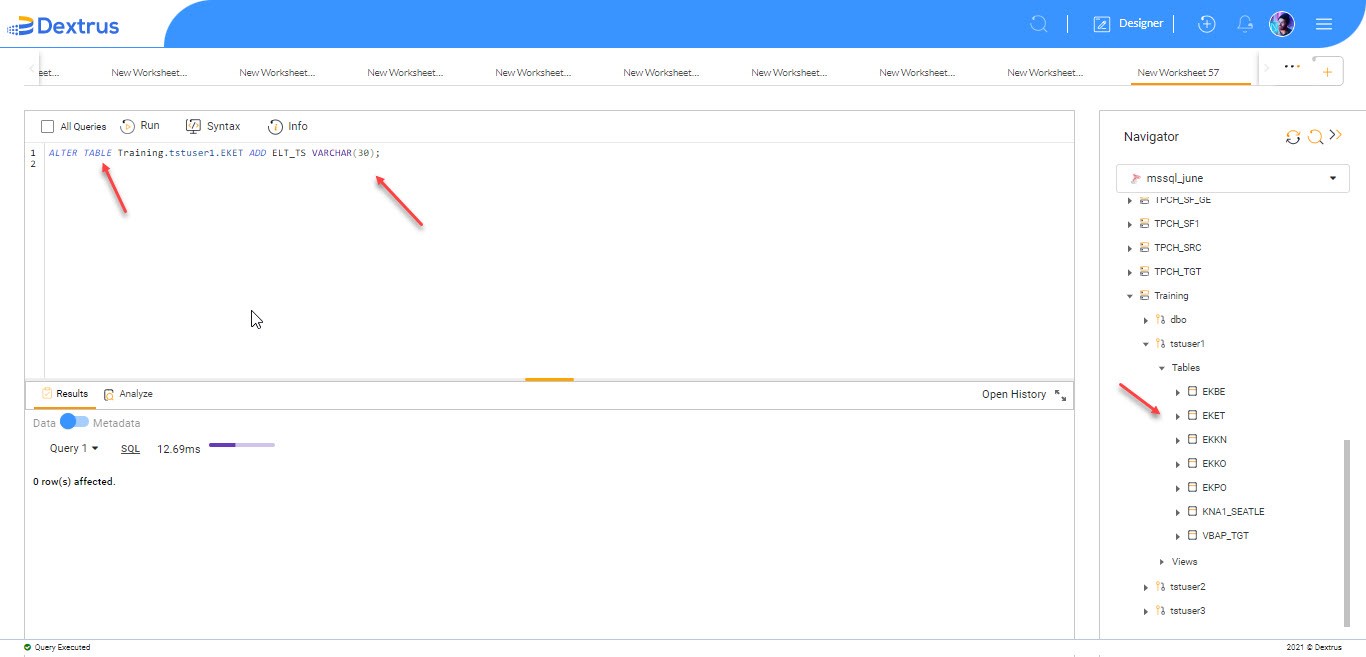
 - From the Navigator drop-down list select ‘mssql_june’ connection.
- Expand the Database: Training, Schema: tstuser1, and Table: EKET.
- Double-tap or drag and drop the EKET table to the Worksheet.
- Prefix the EKET table with the ‘ALTER TABLE’ function.
- To create a new time stamp column in the target table we are using ‘ALTER TABLE’ function.
ALTER TABLE Training.tstuser1.EKET ADD ELT_TS VARCHAR(30);
- Select the query and click the Run button.
- You can see in the Results section: ‘0 row(s) affected’.
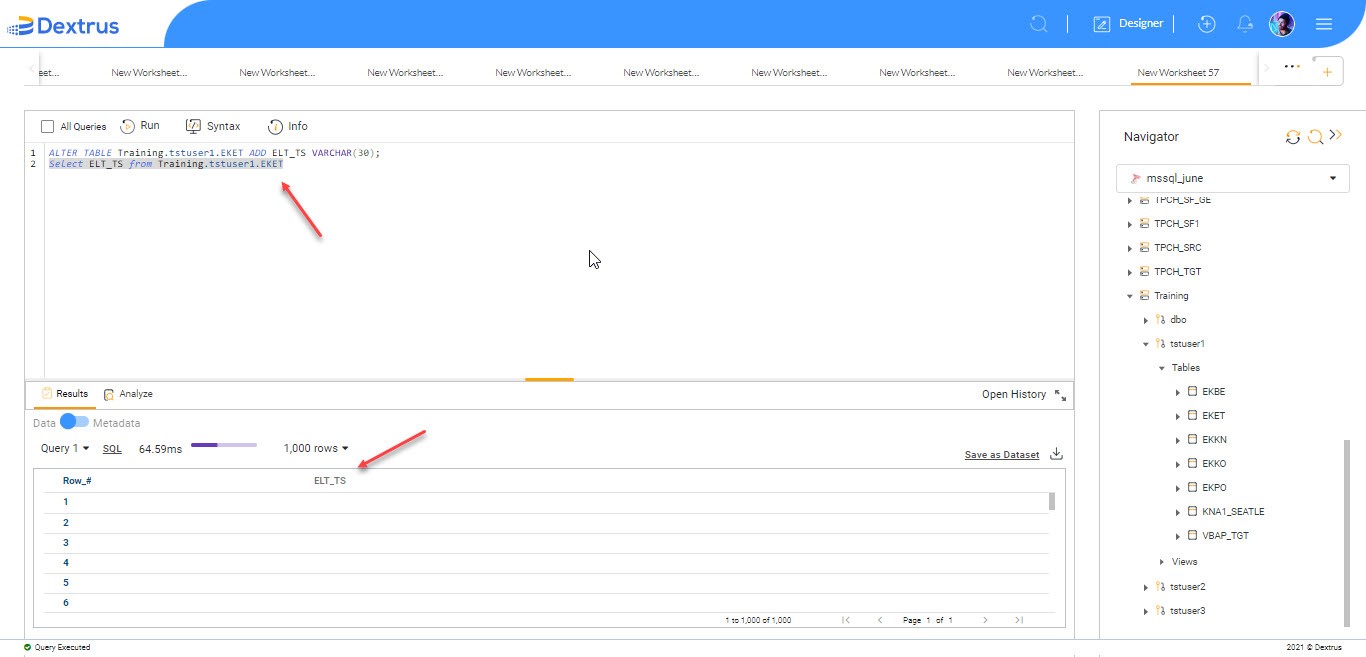
- To check whether a new column ‘ELT_TS’ is created in the target table.
- Type and run the Select query.
Select ELT_TS from Training.txtuser1.EKET;
- You can see in the Results section: a new column name with ‘ELT_TS’ is created.
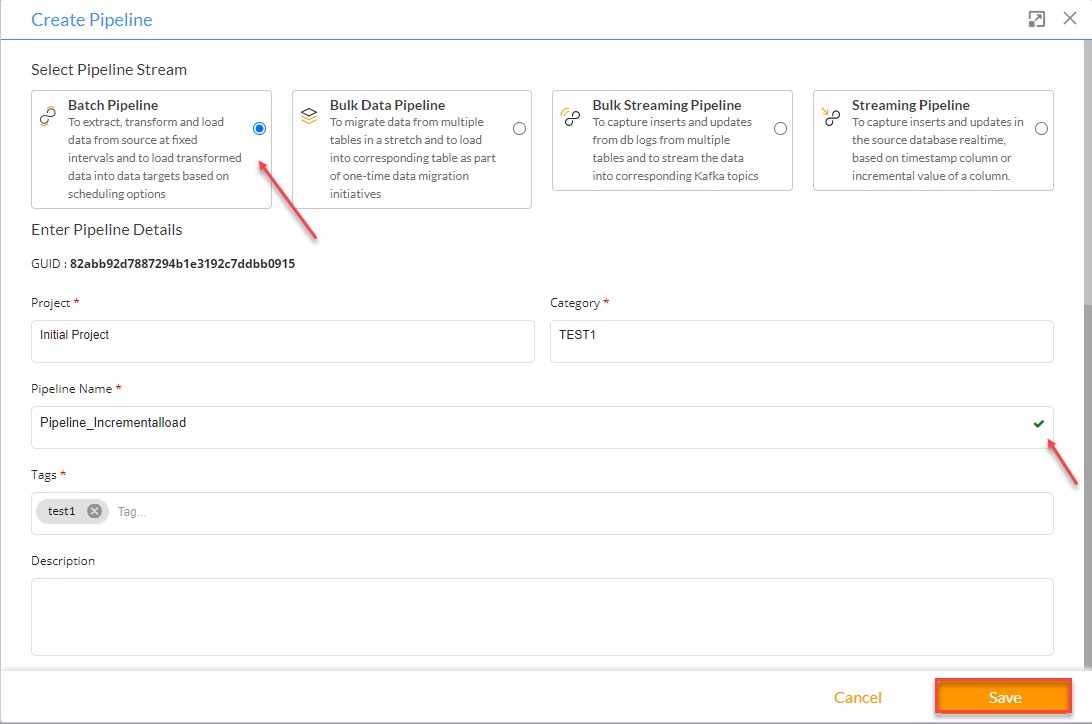
- Navigate to the Designer and click the ‘Create new’ option.
- A Create Pipeline pop-up window is displayed.
- Enter the Pipeline Details, by typing Project, Category, Pipeline Name, Tags, and Description details in their respective text fields.
- Click the Save button to save the pipeline details.
- The Designer page is opened displaying the created pipeline name in the drop-down list.
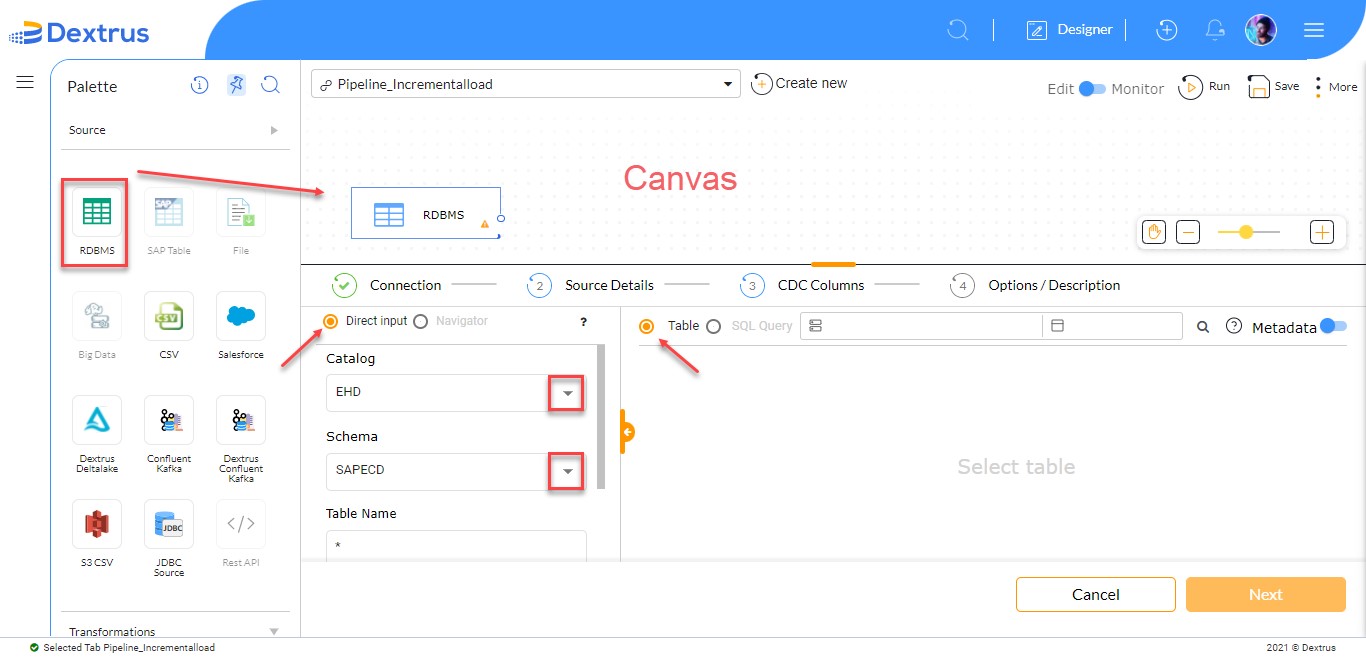
- Drag and drop the RDBMS source onto the canvas.
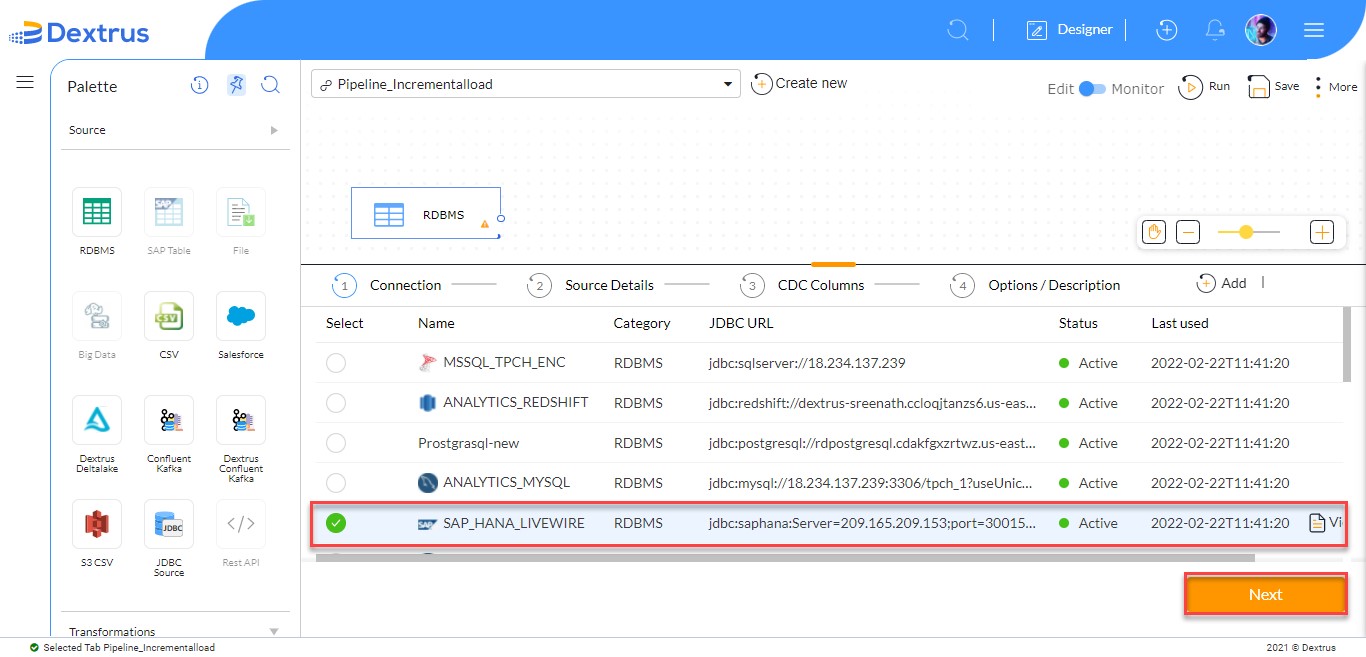
- Tap on the RDBMS source in the canvas to see a list of available connections.
Note: Connection, Source Details, CDC Columns, and Options/Description tabs are displayed. All these tabs are serially numbered to denote progress. To create a new connection, Add button is available.
- Select the 'SAP_HANA_LIVEWIRE' connection under the Connection tab.
Note: Only connections whose status is green color and Active can be used.
- Click the Next button to proceed to the next tab (Source Details).
Note: The Next button gets enabled only when you select an Active status connection.
- The Source Details tab displays two radio buttons namely Direct input and Navigator.
- On the right side pane there are two radio buttons namely Table and SQL Query.
Note: By default, Direct input and Table radio buttons are selected.
The application provides you a free hand to select Catalog, Schema, and Table Name from the drop-down lists, or else you can directly type the SQL Query.
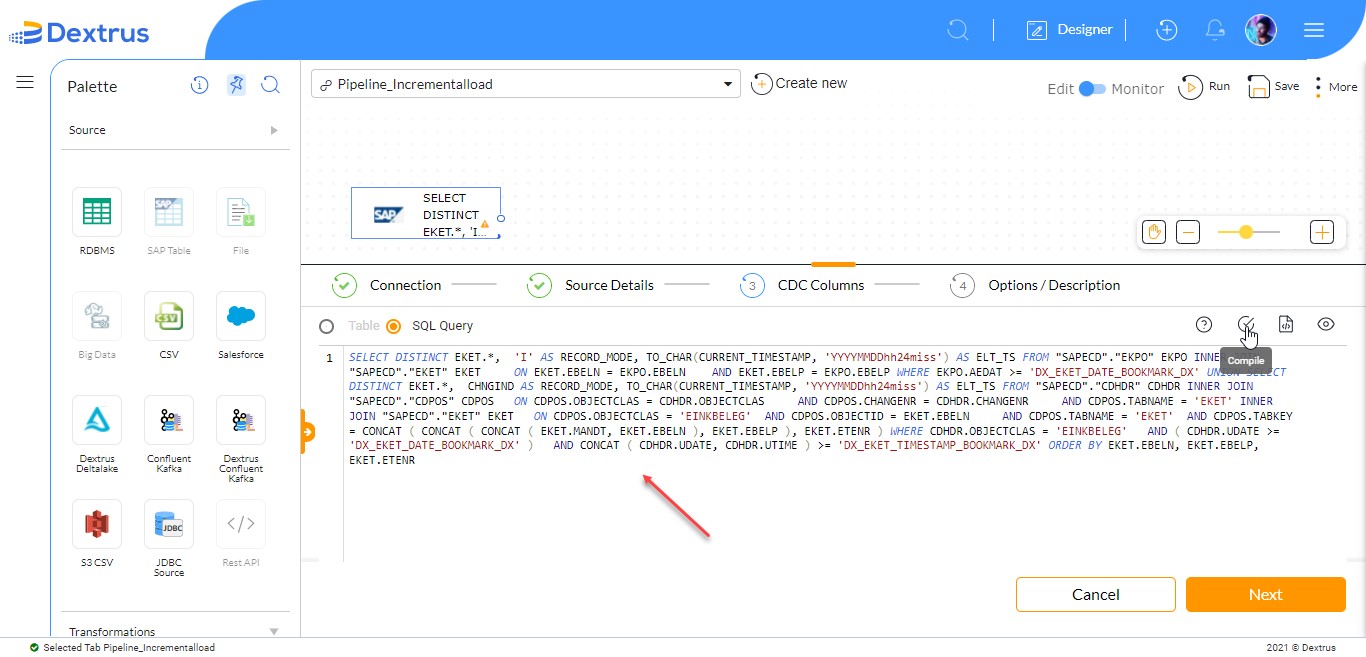
- Select the SQL Query radio button to type or paste the query.
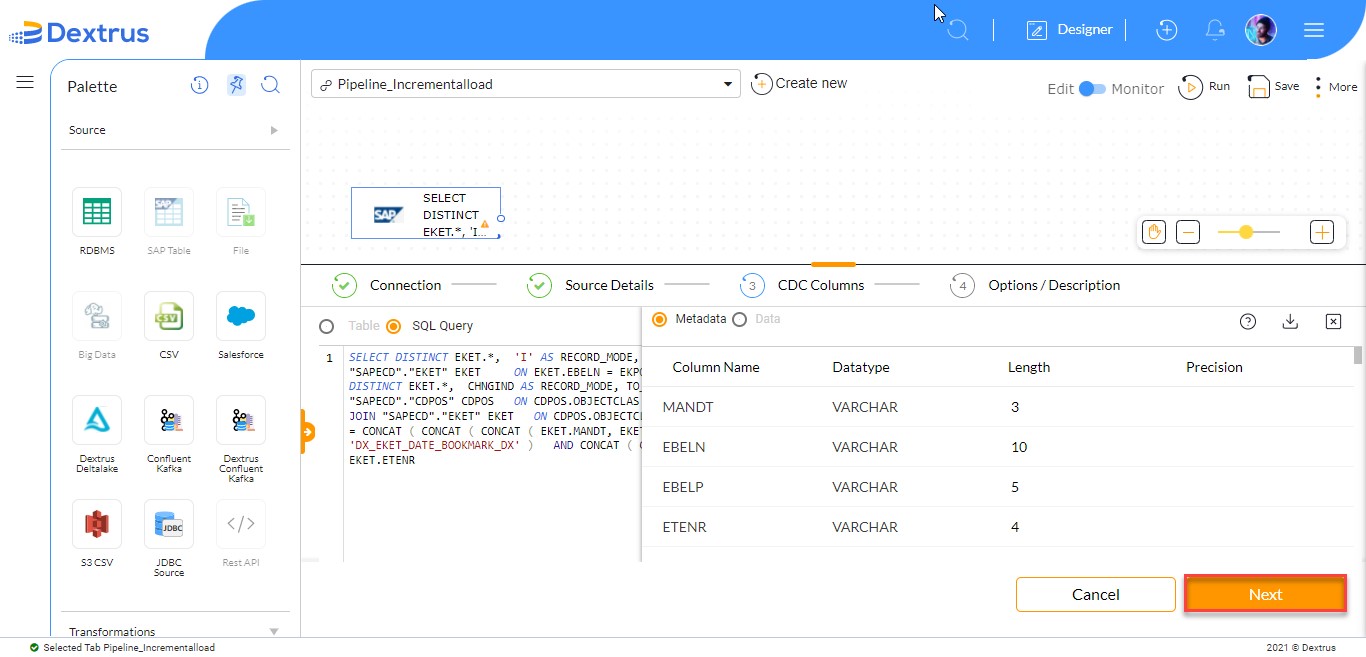
- Click the Compile icon to view table Metadata information in a slide window populated from the left-hand side.
Note: By default, the Metadata radio button is selected.
- Click the Next button to view the CDC Columns tab.
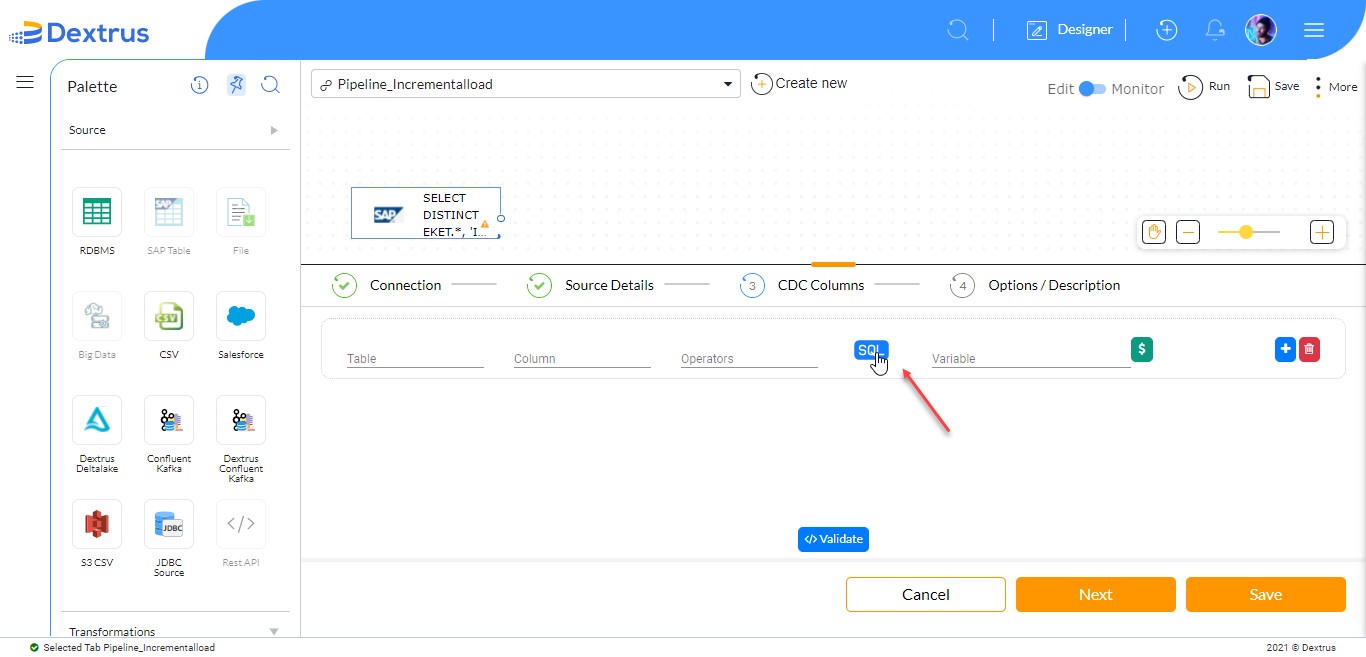
- The CDC Columns tab displays Table, Column, and Operators drop-down lists.
- Click the SQL button.
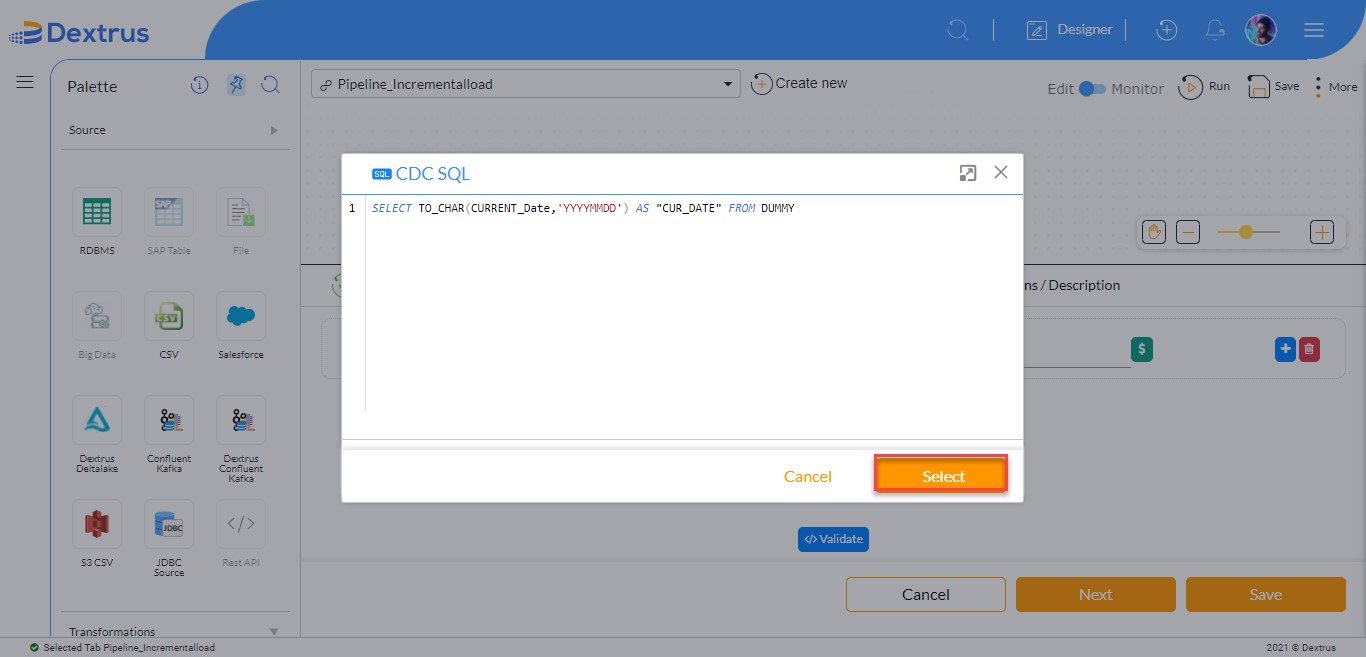
- A CDC SQL pop-up window is displayed.
- Type the query “SELECT TO_CHAR (CURRENT_Date, ‘YYYYMMDD’) AS “CUR_DATE” FROM DUMMY” in the pop-up window screen.
- Click the Select button.
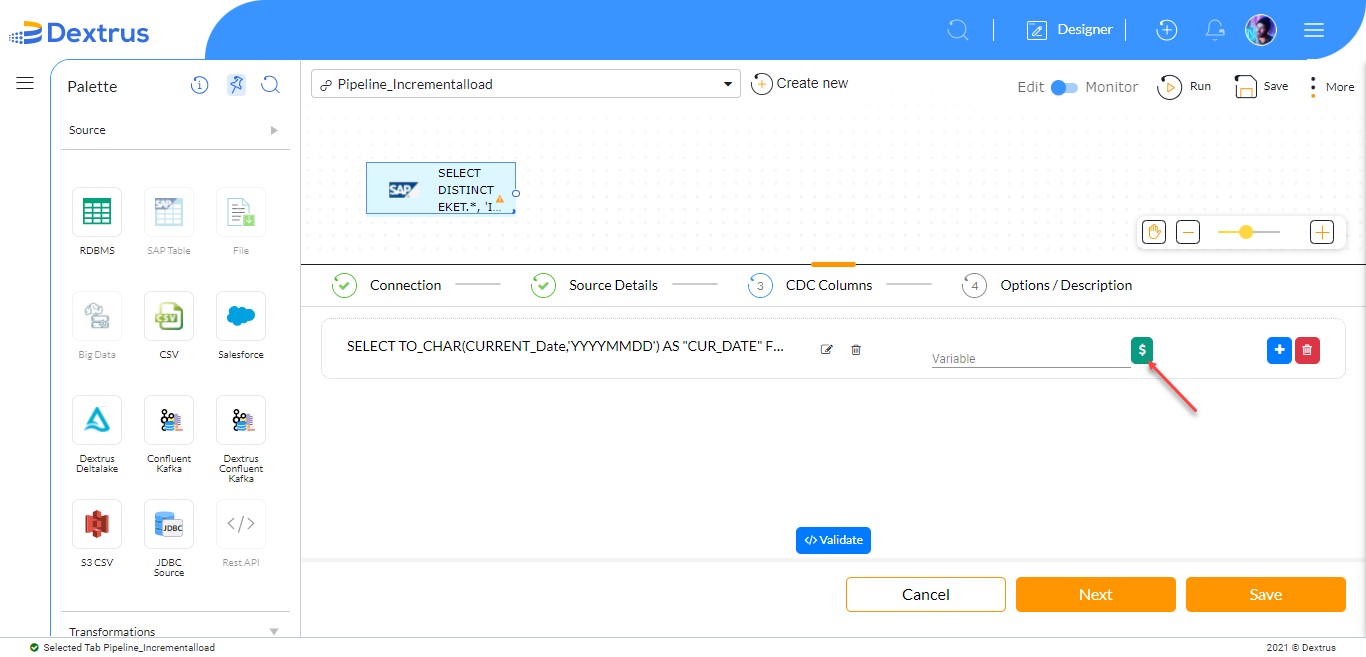
- The typed SQL query is updated in the CDC Columns tab.
- Click the $ icon.
- A Variables pop-up window is displayed.
- A list of all existing variables is displayed.
- The Existing and New radio buttons along with a Search text field are also displayed.
Note: By default, the Existing radio button is selected.
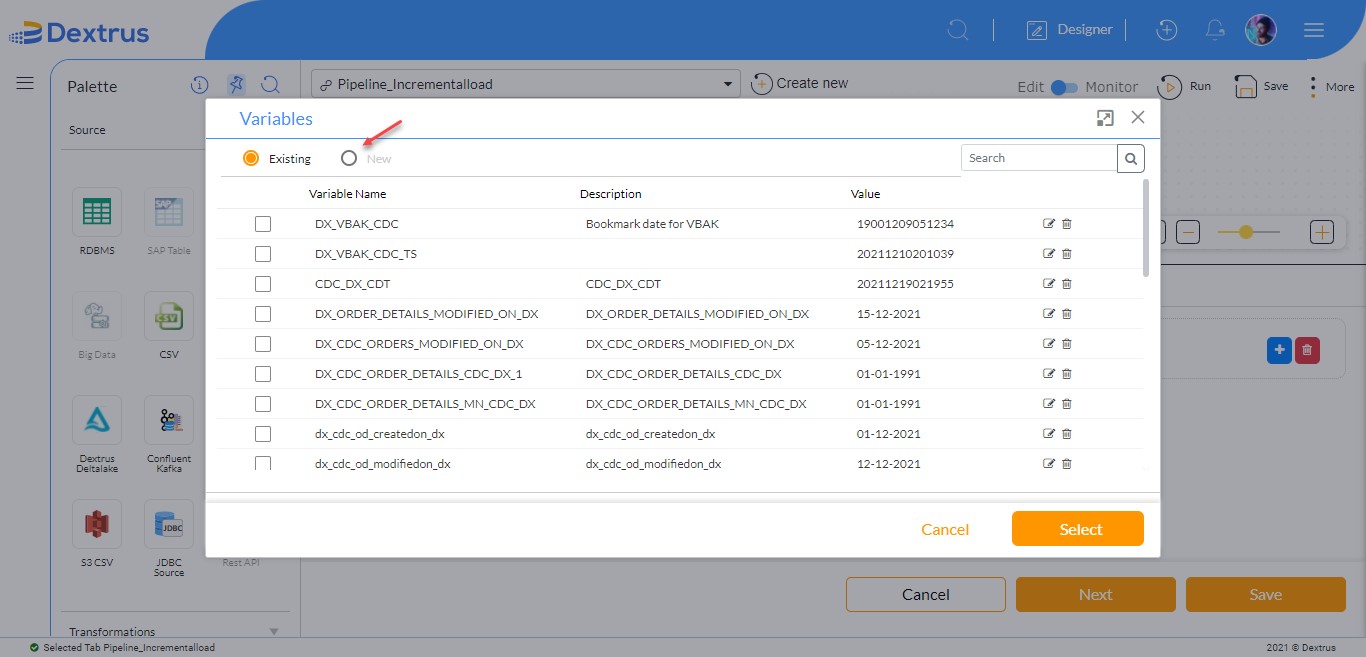
- Click the New radio button to create a new variable.
- Type a variable name for eg: “DX_EKET_date” in the Variable text field.
Note: A green color tick mark with the text ‘Name is available’ appears beside the text field if the typed variable name is never used.
- Type the default value for eg: ‘19000101 in the Default Value text field.
- Type a description of your choice in the Description text field.
- Click the Create button to submit the newly created variable.
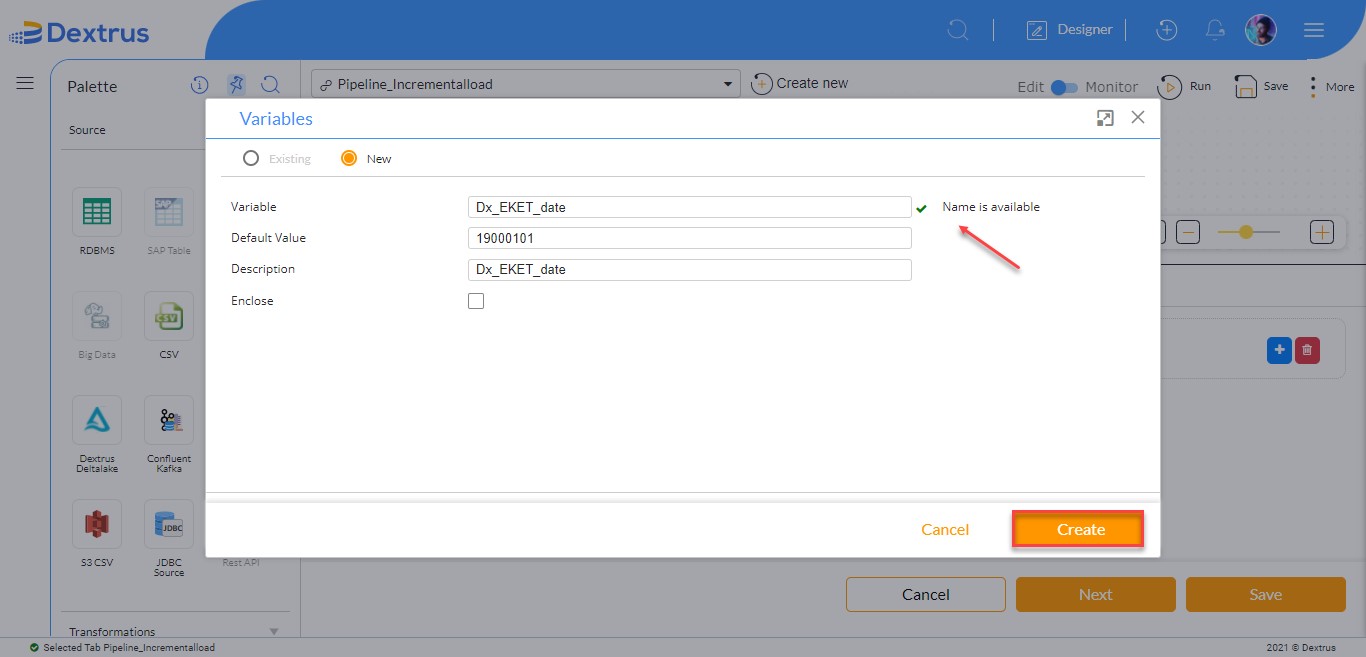
Note: Follow the above steps (as Date) to create a variable for TimeStamp (SELECT TO_CHAR(CURRENT_TIMESTAMP,' YYYYMMDDhh24miss') AS "CUR_STS" FROM DUMMY) as well.
- Click the Validate button in the CDC Columns tab.
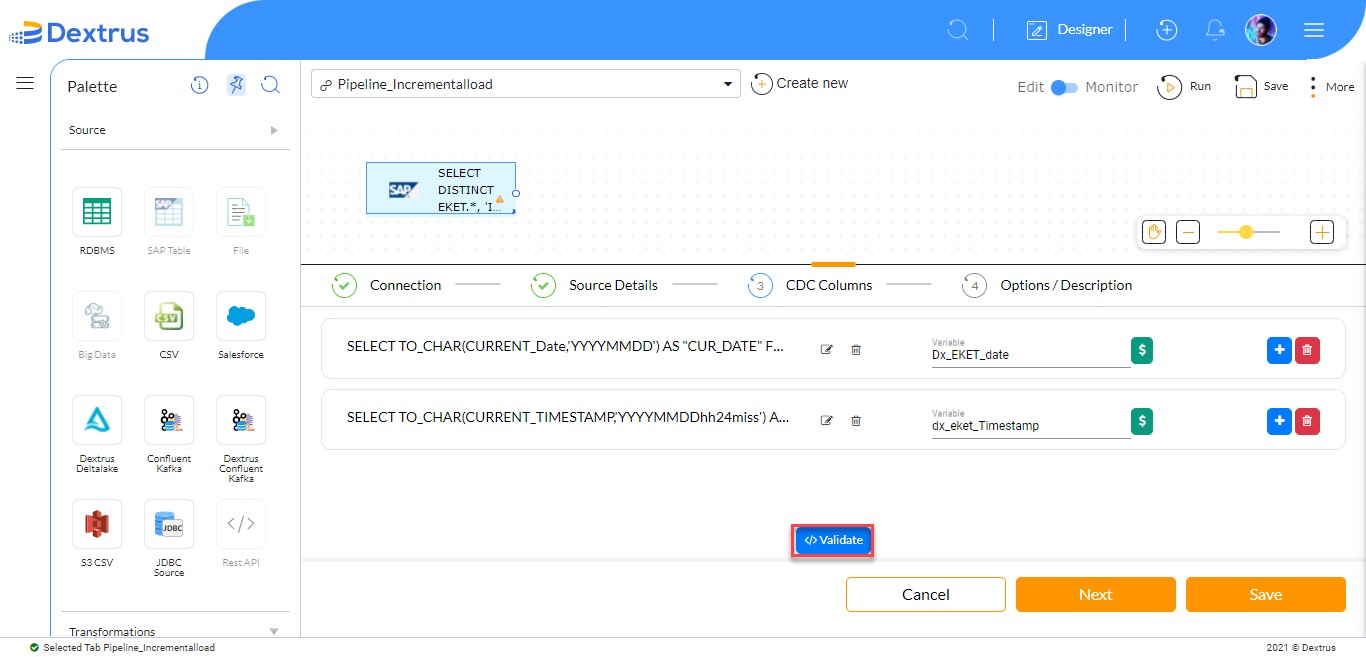
- The generated SQL Query displays new variables (Date and TimeStamp) incorporated in it.
- Click the Compile icon.
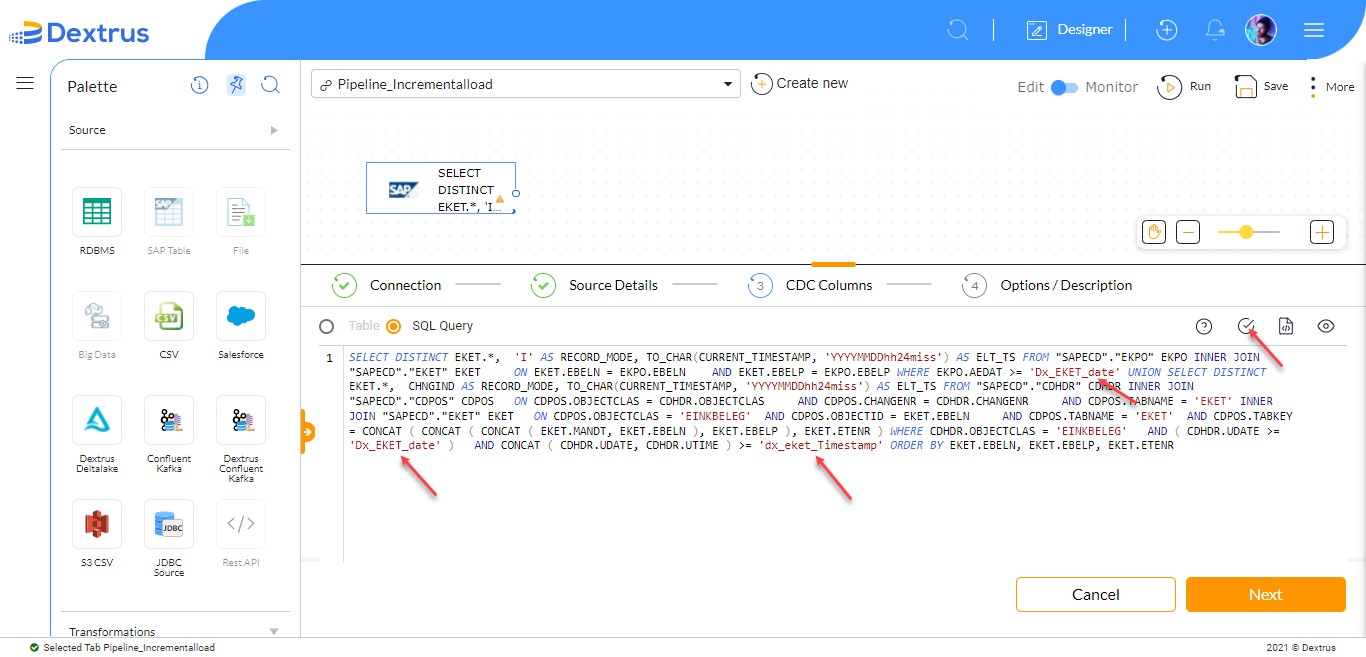
- The Metadata information is displayed with new variables.
- Click the Next button to close the slide screen.
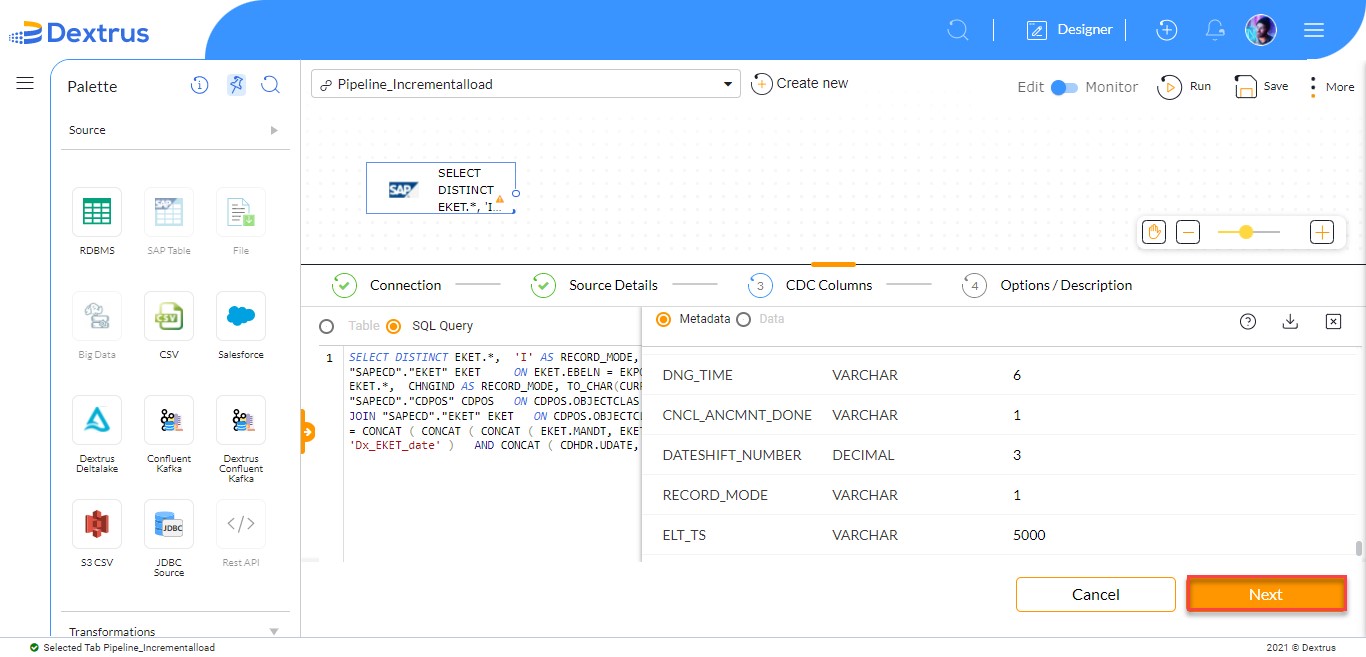
- Click the Save button on the CDC Columns tab.
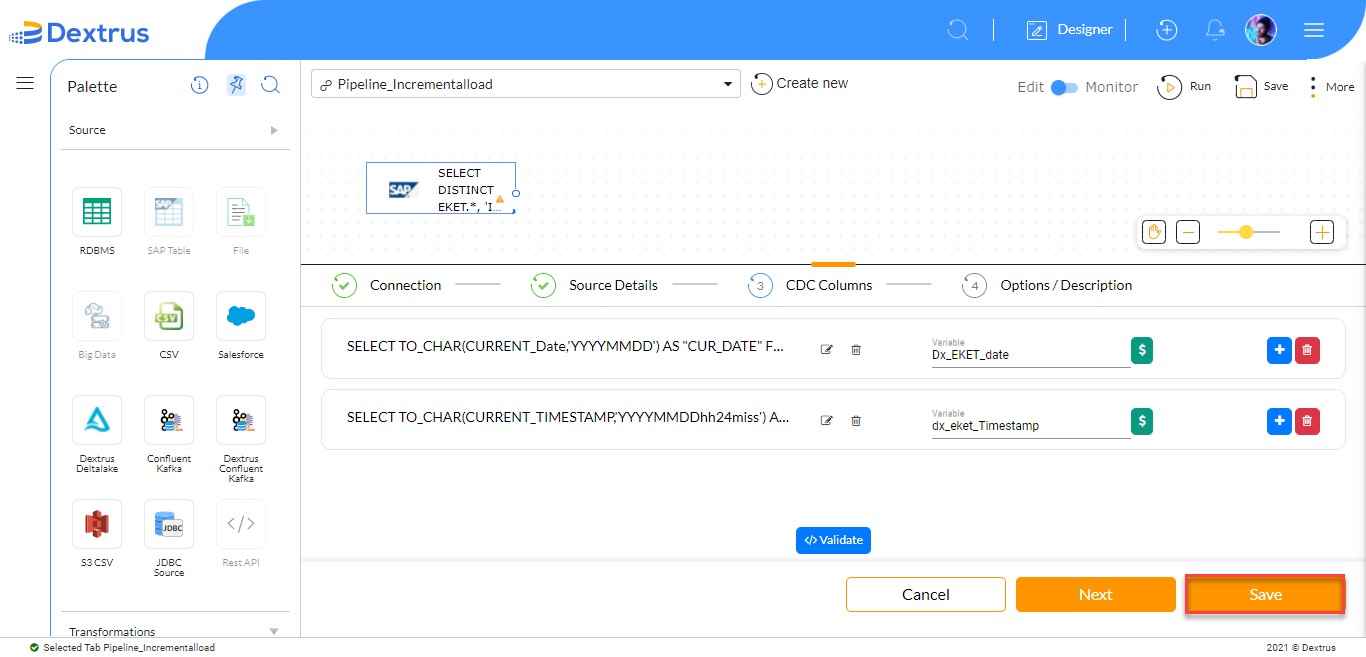
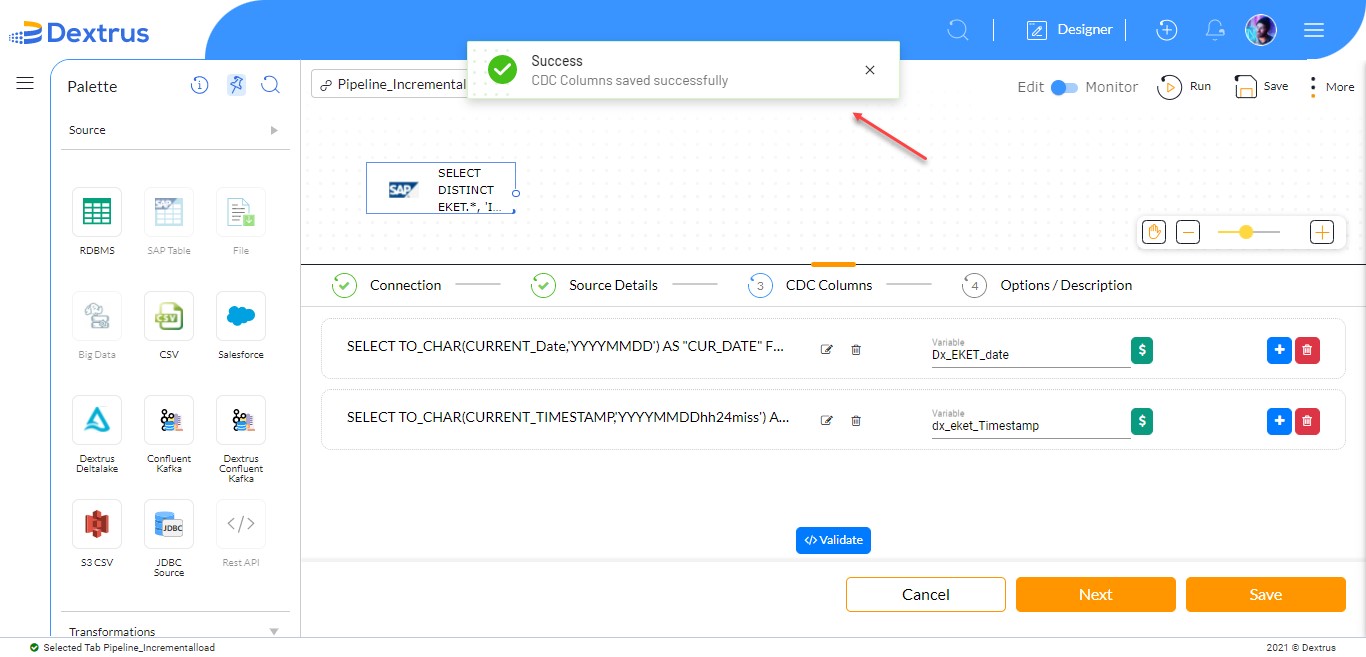
- A message “Success CDC Columns saved successfully” is displayed on the top of the page.
- Click the Next button in the CDC Columns tab.
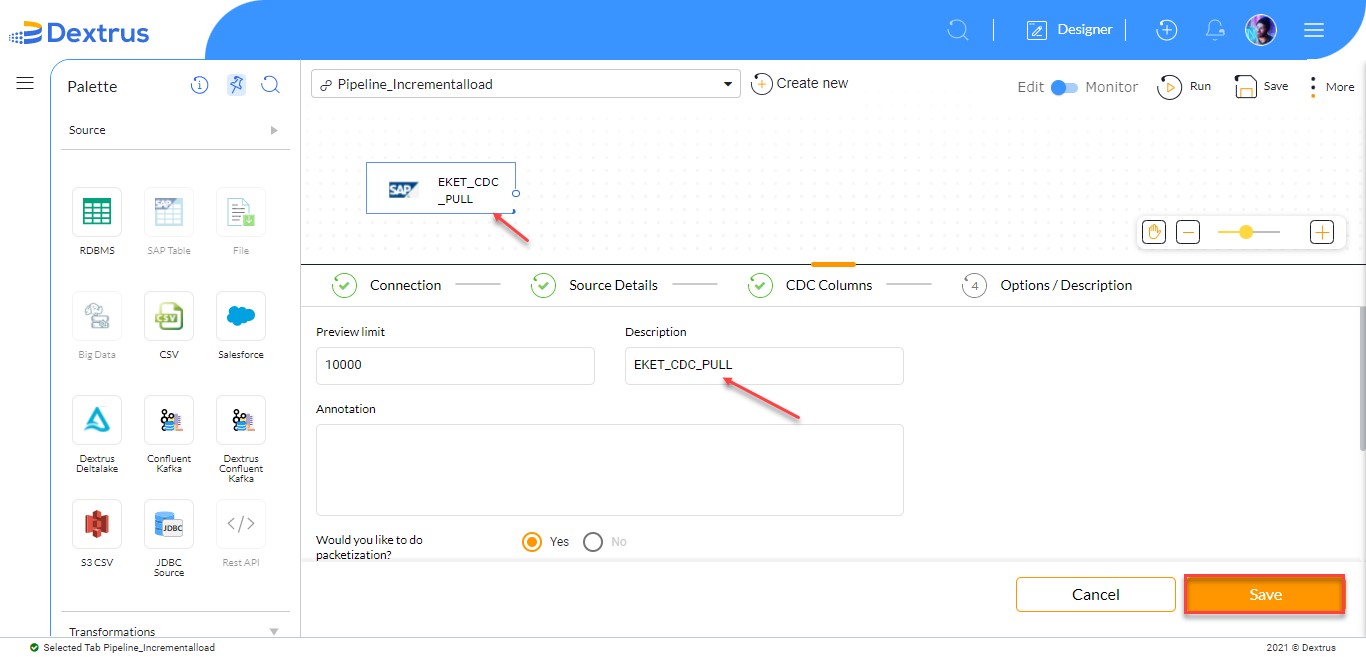
- The Options/Description tab is displayed where you can rename the description of the source widget as “EKET_CDC_PULL” from the description text field.
- The default, Preview limit is set to 10000.
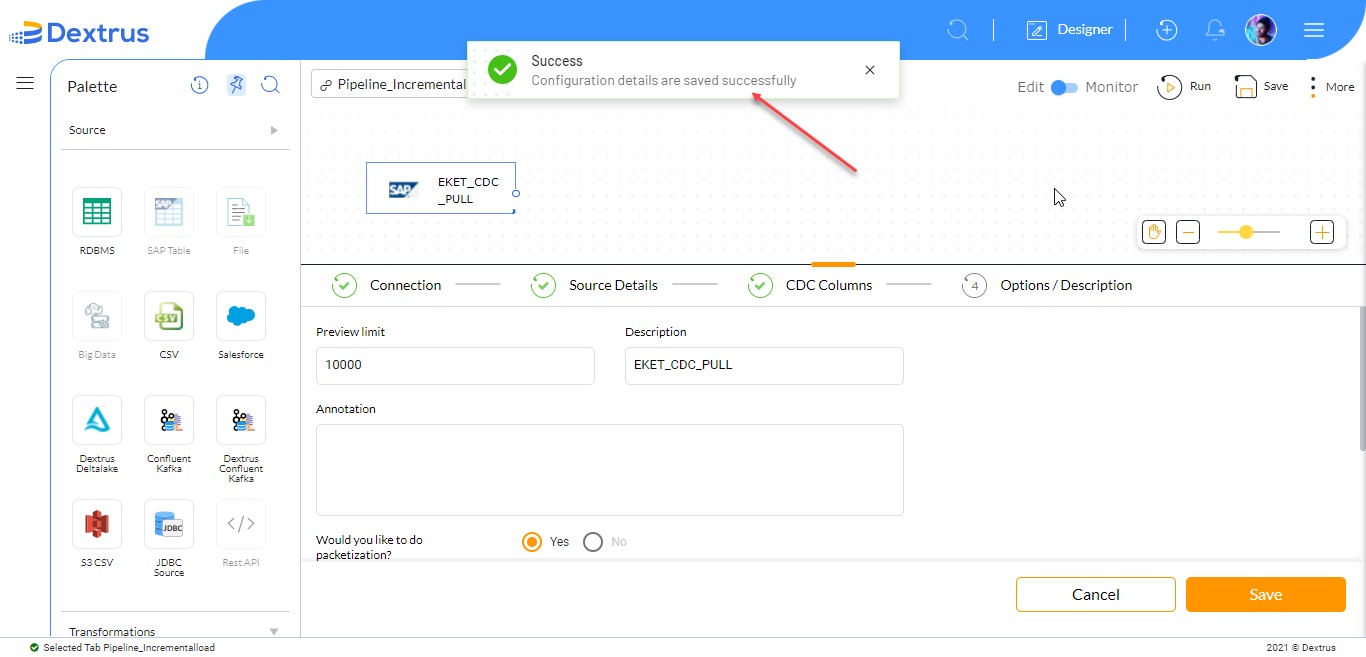
- Click the Save button.
- A message “Success Configuration details are saved successfully” is displayed on the top of the page.
- Navigate to the Sink widgets on the left pane of the page.
- Drag and drop the SQL Server Merge widget onto the canvas.
- Connect the SAP HANA source output port to the SQL Server Merge sink input port.
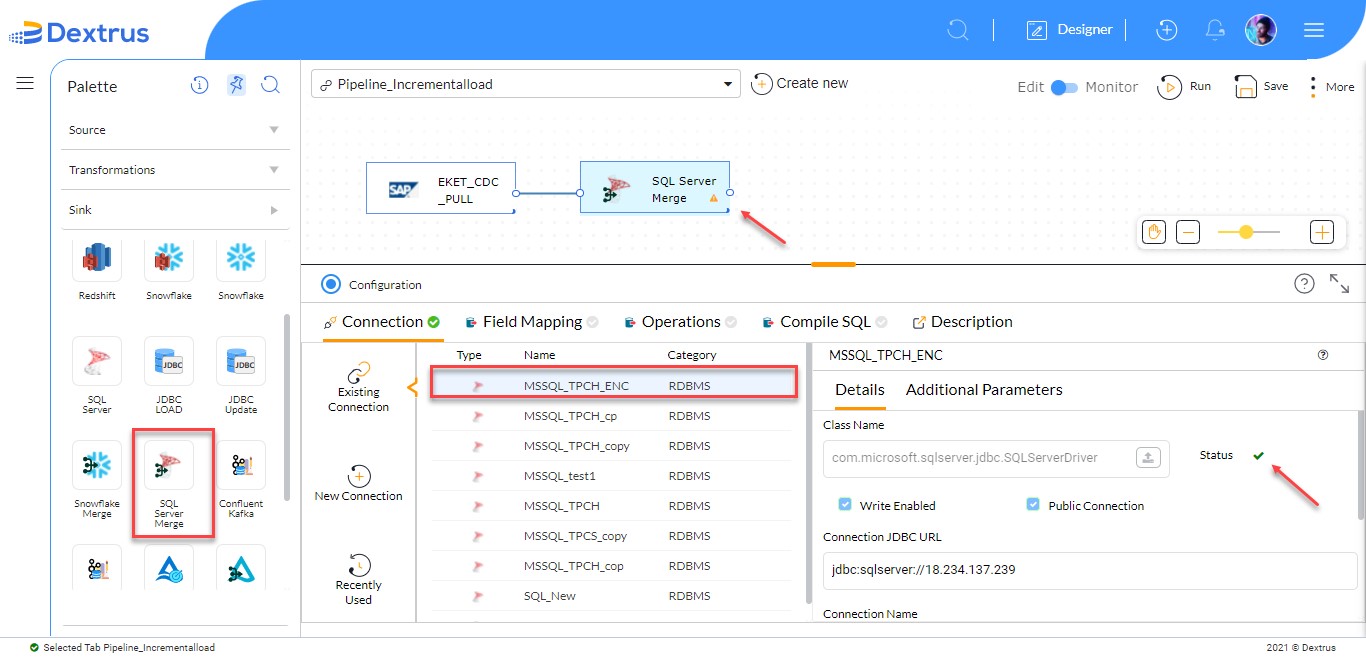
- Tap the SQL Server Merge widget to configure.
- Select the “MSSQL_TPCH_ENC” connection from the Existing Connection list.
- A green color tick mark is displayed in the Details section indicating the connection is active.
Note: By default, the Connection tab is selected. A warning icon is displayed in the SQL Server Merge widget indicates its configuration is not yet completed.
- Click the Field Mapping tab.
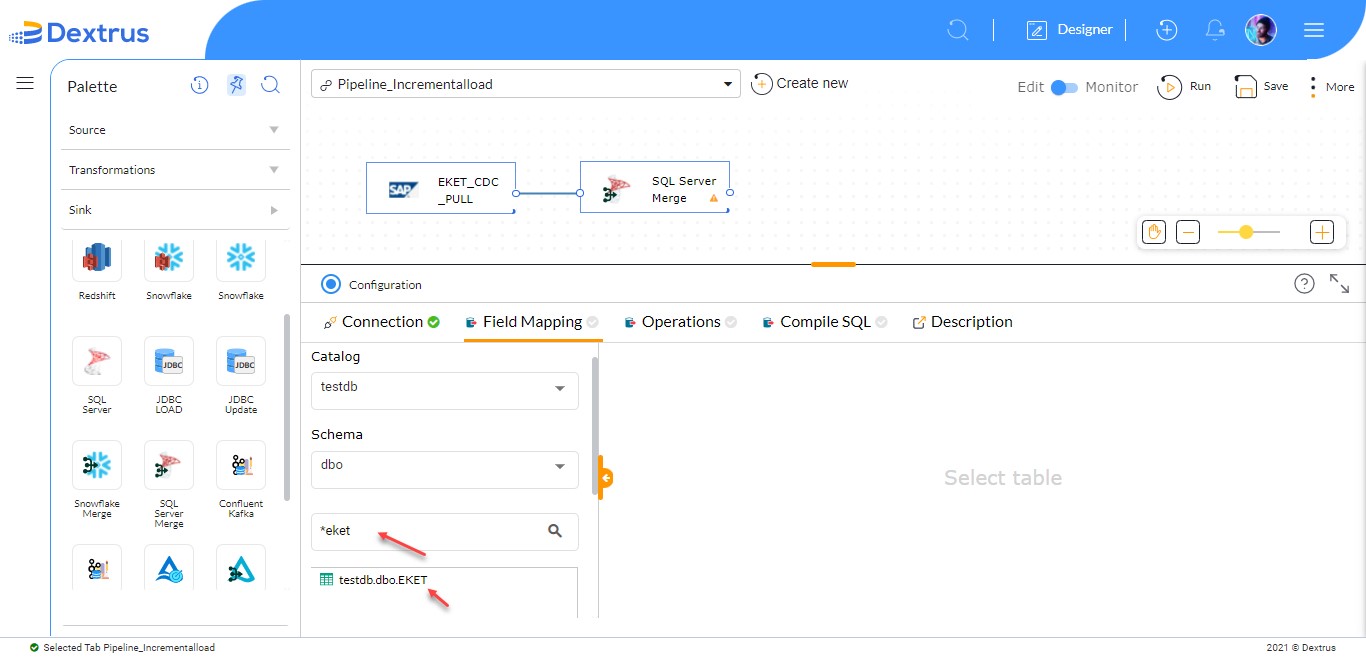
- Select the “testdb” catalog from the Catalog drop-down list.
- Select the “dbo” schema from the Schema drop-down list.
- Search for a table name by typing text ‘eket’ in the search text field beside the asterisk and press Enter from the keypad.
- Click the “testdb.dbo.EKET” table name.
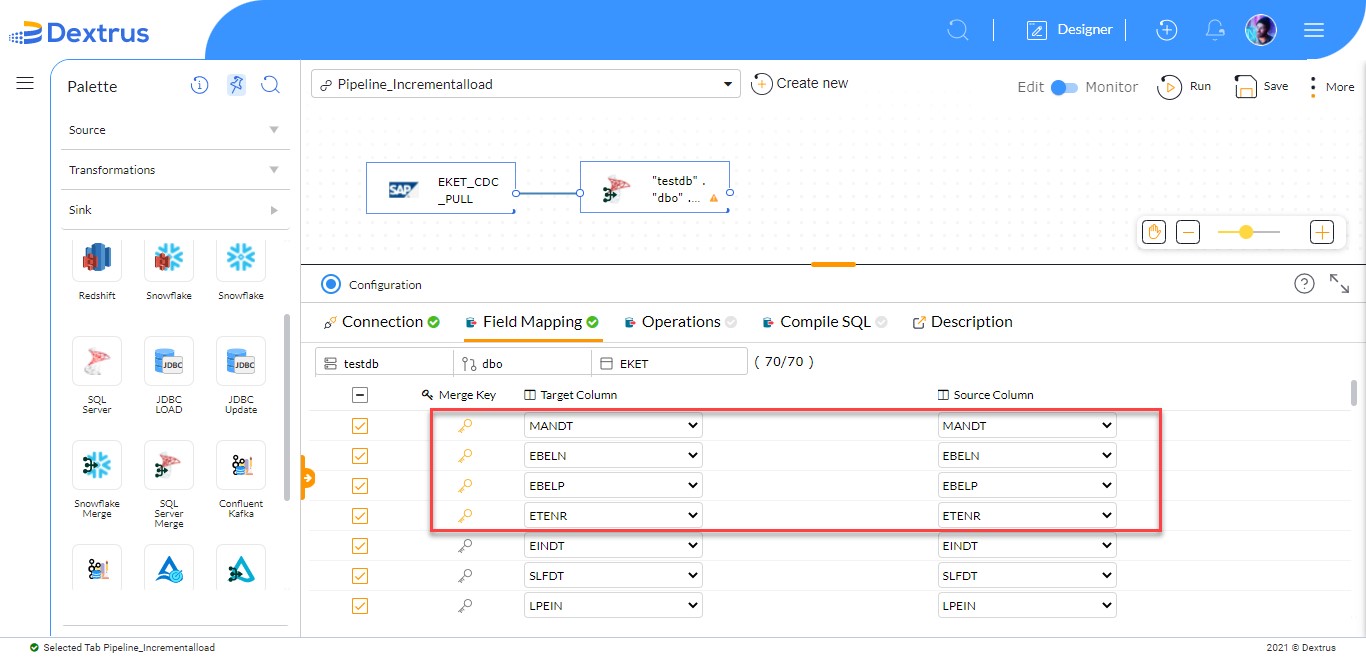
- The Field Mapping tab is updated with all column names, fed from Source and Sink tables.
- By default, all the checkboxes are selected.
- Click the greyed-out Key icon against each row to make it a Merge Key.
- The Merge Key icon turns yellow color.
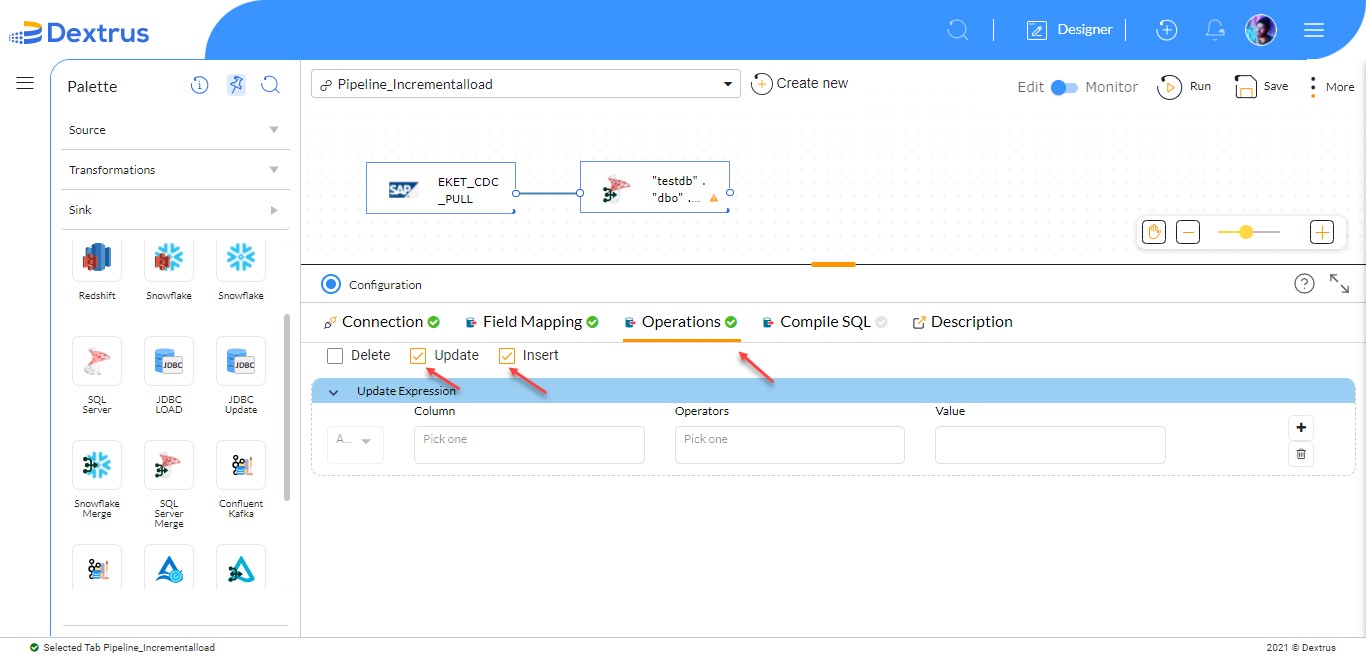
- Click the Operations tab.
- Select the Update and Insert checkbox.
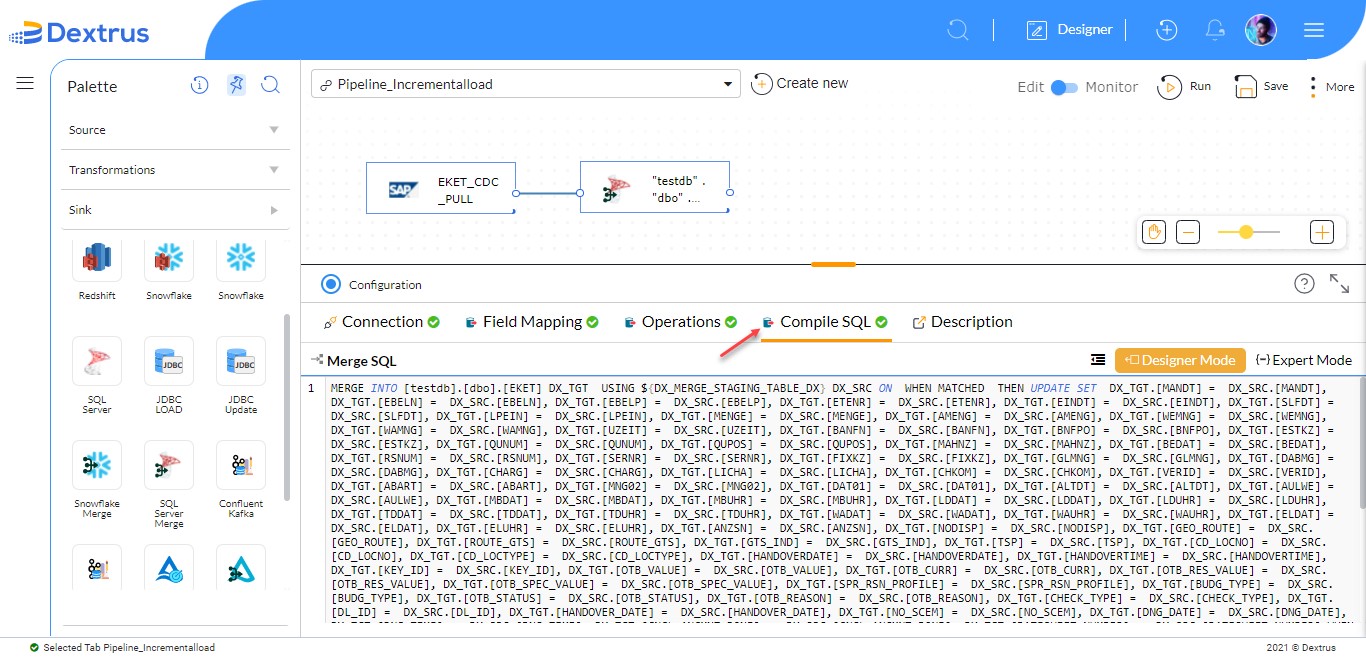
- Click the Compile SQL tab.
- The Merge SQL query is generated based on the selected options in the Operations tab.
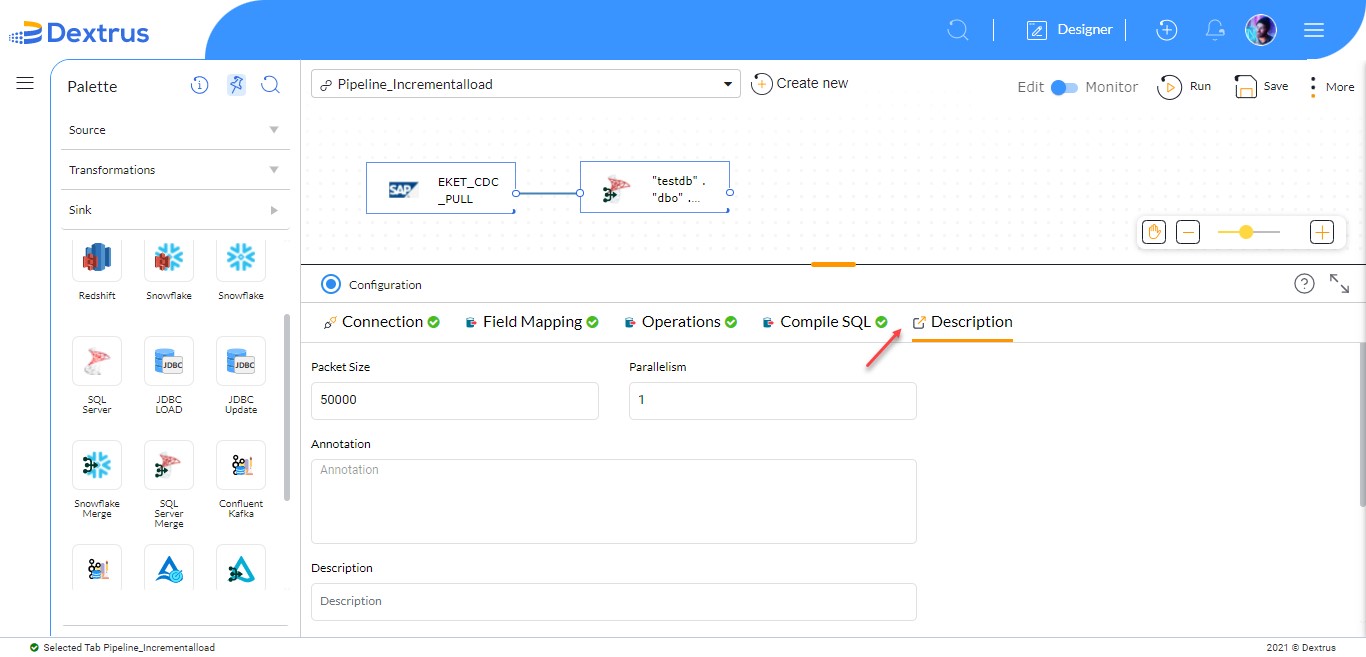
- Click the Description tab.
- By default, the Packet Size and Parallelism text fields are populated with ‘50,000’ and ‘1’ values.
- Navigate to the Miscellaneous widgets on the left pane of the page.
- Drag and drop the Update Variable widget onto the canvas.
- Connect the SQL Server Merge widget output port to the Update Variable input port.
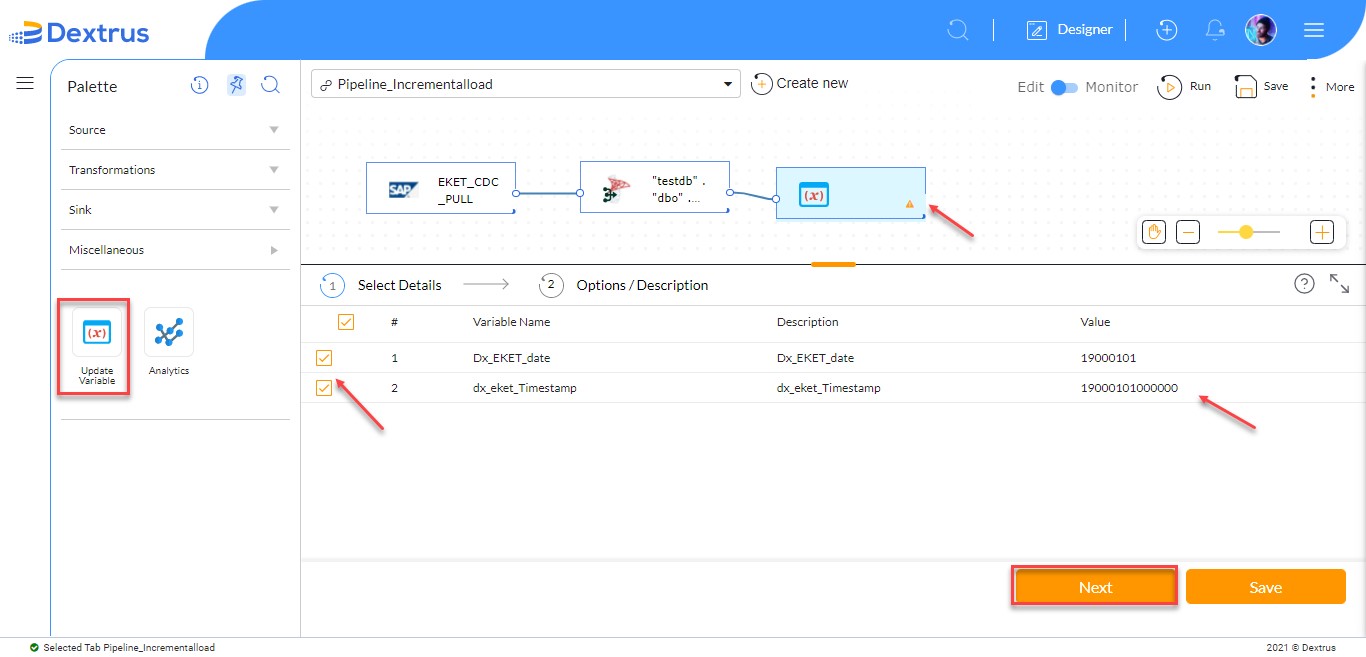
- Tap the Update Variable widget to configure.
- The Select Details tab with Variable details (created previously) are displayed.
- Select the checkbox against the two Variable Names.
- Click the Next button.
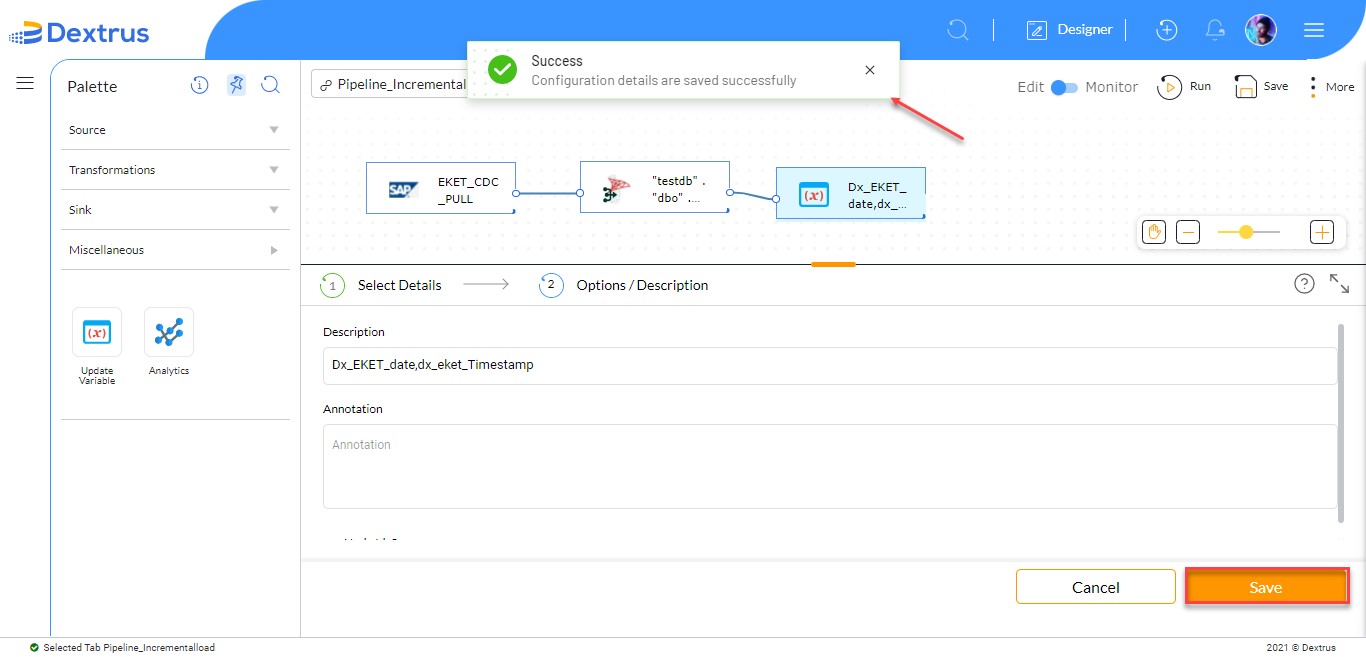
- The Options/Description tab is displayed.
- The Description text field is auto-populated with the variable names declared in the CDC Column tab previously.
- Click the Save button to save the Update Variable details.
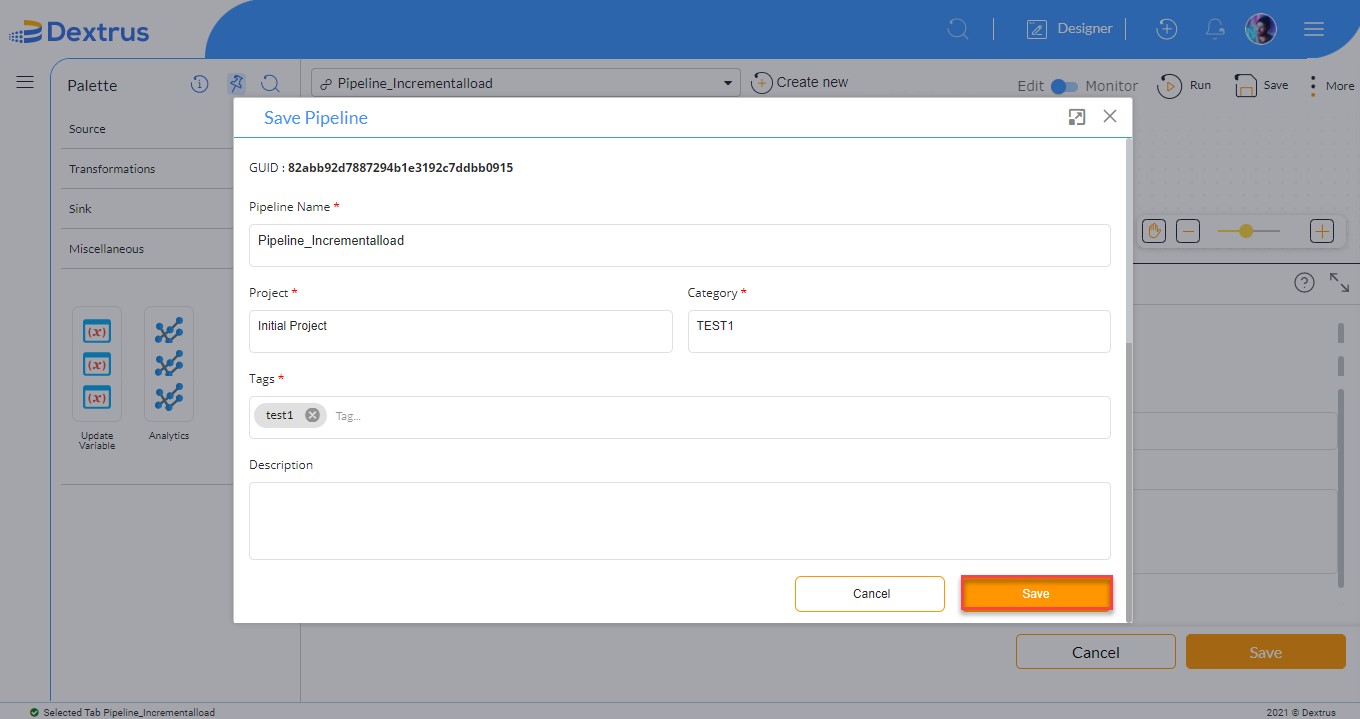
- Click the Save button on the top right corner of the page to save the details.
- The Save Pipeline pop-up window is displayed.
- Click the Save button in the pop-up window.
- Click the Run button on the top right corner of the page beside the Save button.
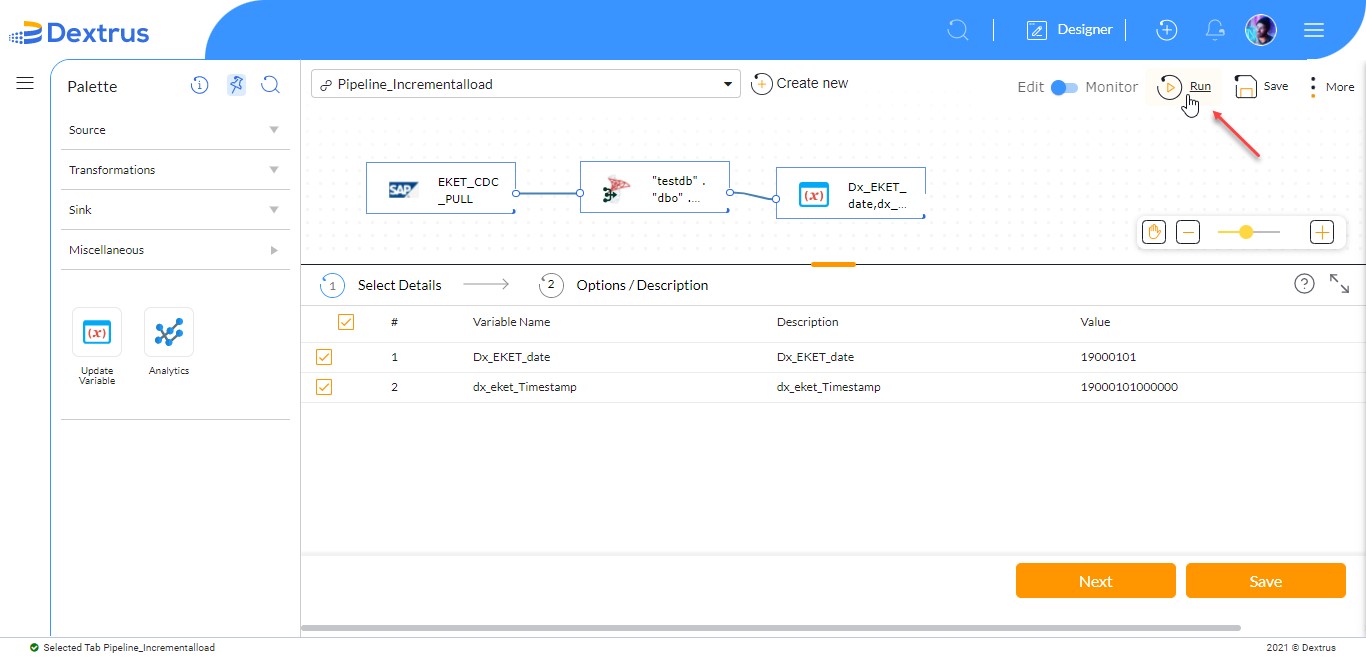
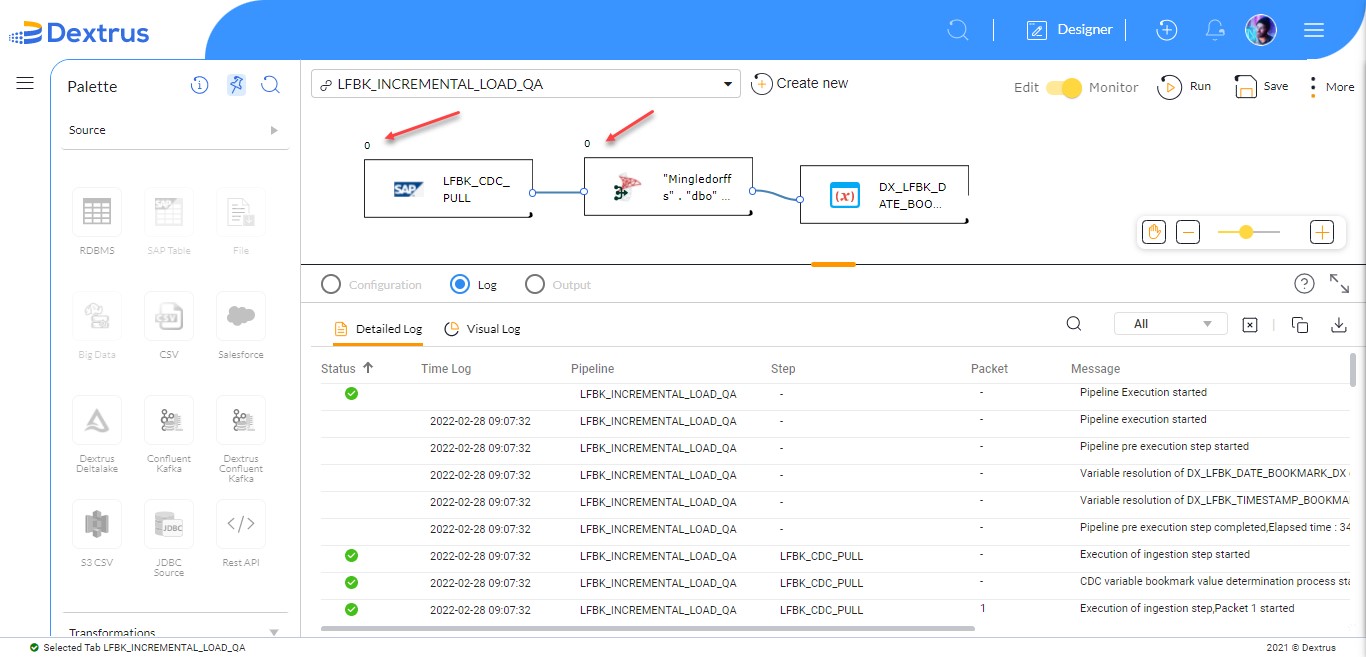
- The pipeline is executed successfully and the records count is displayed on the top of each widget.
Note: The records count is Zero since new records are not inserted or updated in the SAP HANA source widget.